
Few areas in America have experienced a more dramatic change in fortunes as extreme as Southern California’s Inland Empire. From 1990-2008, the Inland Empire (Riverside & San Bernardino counties) has been California’s strongest job generator creating 20.1% of its employment growth. The area also consistently ranked among the nation’s fastest growing large metropolitan areas. However in 2008, the mortgage debacle has sent this area, which had not seen year-over-year job losses in over four decades, into a steep downturn. Understanding what happened and how to put the region back on its historical growth path offers an important public policy perspective not only for the Inland Empire but for other once fast-growing metropolitan areas.
The Economic Problem. The California Employment Development Department (EDD) reported an Inland Empire loss of 17,900 jobs from August 2007-2008. The bulk of this was directly tied to the housing meltdown. Within shrinking sectors, the loss was 32,600 with 82% (26,800) tied to the demise of residential construction. This included construction losses (-16,000); non-vehicle manufacturing (mostly building materials: -5,600), non-vehicle retail sectors (mostly furniture or home supplies: -3,200); and financial groups like escrow, title, insurance and real estate (-2,000). By September 2008, unemployment was 9.1%, the highest in 49 metropolitan areas with over 1,000,000 people.'
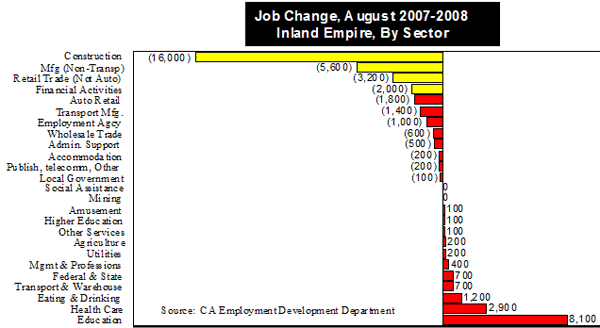
Note: EDD’s report is an underestimate as more accurate U.S. Bureau of Labor Statistics data show the area began 2008 with job losses 61.7% higher than EDD’s estimates.
Housing Market Creates A Recession. Some history is necessary to understand how the housing sector got into trouble and set off the inland recession. The last housing downturn ended in 1996. Analysts agree that from 1997-2003, California’s many building restrictions prevented housing supply from matching demand by families needing homes. Prices rose to chase away excess potential buyers:
- Seasonally adjusted homes sales rose from 13,227 quarterly units in early 1997 to 25,328 by late 2003, an annual rate of 10.1%.
- In this period, median price increased from $105,643 to $246,807, an annual rate of 12.9%.
Starting in 2004, speculators began wanting to capitalize on these 12.9% gains by buying and flipping homes. Simultaneously, foreigners awash in dollars from U.S. trade imbalances started flooding investment markets with cash looking for “safe” returns. A belief that home prices never fall led to the development of variable rate mortgages with extremely low “teaser” rates and loose underwriting standards, plus AAA rated mortgage backed securities based on them. The low rates financed the speculators and convinced many families to buy over-priced homes or borrow newly found “equity.” Thus:
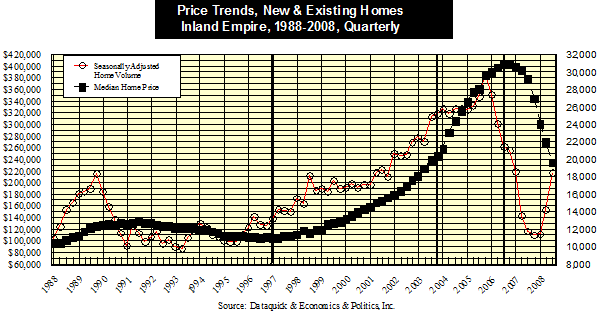
- Median home prices increased even more aggressively from $246,807 in late 2003 to a $404,611 peak in third quarter 2006, up at a 19.7% compound rate.
- Seasonally adjusted sales increased from 25,328 in late 2003 to a peak of 29,670 in fourth quarter 2005, up a modest 2.29% compound rate.
- However, by first quarter 2006, volume began declining as affordability reached just 18% and even speculators no longer saw much upside.
- By the price peak in third quarter 2006, seasonally adjusted sales were down 27.6% to 21,478 units.
Once the fall in demand became evident, median prices started down. The descent began slowly. However, by mid-2007, with the myth of ever-rising prices debunked:
- Housing demand plunged.
- Housing supply took-off as sub-prime mortgages began resetting from teaser to market rates with investors and homeowners trying to sell homes they could no longer afford.
- Price declines thus accelerated causing ever more homeowners to be upside-down on their homes.
- Unable to sell, many houses entered foreclosure and were aggressively marketed by the lenders, further accelerating price declines.
By 2008, the market began changing:
- Supply, with 60% of inland activity from foreclosures, continued to overwhelm demand with prices falling to a median of $237,784 by third quarter, equal to the mid-2003 level.
- Demand hit a trough in late 2007 at 11,398 units. By third quarter 2008, lower prices caused it to rebound to 18,453, up 61.9%, equal to volume in 2001.
- Demand rose as inland housing affordability reached 50% (assuming 3% down, 6.19% mortgages, 1% taxes, $800 property insurance, 0.5% FHA insurance, payments 35% of income).
Crucially, by third quarter 2008, home construction all but halted as price competition from foreclosures caused developers to lose money on every unit built -even with land treated as free. Hence, the steep downturn and a 9.1% inland unemployment rate. In the short run, conditions will worsen as office construction stops once existing projects are completed. Already, the loss of tenants in fields like escrow and finance has pushed vacancies from 7.0% to 19.9%.
The Routes Out? With the Inland Empire’s construction sector shutting down, economic hardship has spread far beyond those whose terrible decisions created the crisis. This is also is true in numerous markets, particularly in Arizona, Florida and Nevada.
Until national action reduces the rising flow of foreclosures into the supply side of the nation’s housing market, supply will continually overwhelm demand sending prices downward. Residential construction will not return until markets see fewer foreclosures and prices move to higher levels. Two strategies are available:
- Mortgage servicers can lengthen the term of mortgages and reduce rates. allowing families to afford staying in homes. However, given the principal owed, they will not be able to move until prices return to recent highs. Many are thus walking away.
- Servicers can reduce the principal owed, allowing families to refinance and both remain in their homes and have equity in them.
Modern housing finance has generally barred the second and more effective strategy. When banks originate mortgages, they typically sell them to Fannie Mae, Freddie Mac or investment houses to get their money back and make more loans. They are paid to service loans they no longer hold. Meanwhile, secondary mortgage holders often formed them into groups and then sell “mortgage backed securities” (MBS) worldwide. Both the originating bank and those creating MBS’s signed contracts barred them from harming investors. Unless a servicer owns 100% of a mortgage or MBS, they cannot lower mortgage principals.
Unless national policy can convince secondary mortgage holders and/or MBS investors to allow the principal owed them to be reduced, the foreclosure crisis and residential construction depression will persist … prolonging the recession. The state attorneys general, Congress, some major banks and the FDIC have tried to lure mortgage investors to allow this or to buy them out. The results have been very mixed. The idea of allowing bankruptcy judges to lower principals has been offered as a club to force this result. Yet this raises fear of long term damage to international belief in the consistency of U.S. contract law.
Finally, at the local level, officials could favorably impact construction costs through the developer impact fees imposed on new homes. These are justified by the need to build the infrastructure required by population increases. Inland Empire fees are $40,000 to $50,000 per home. An analysis shows that at today’s low prices, a fee holiday of 80% by local agencies and 40% by schools would put the industry profitably back return to work. The re-imposition of fees could be tied to an index like median existing home prices.
So far, the reaction of local decision makers has been that this is legally, programmatically and politically impossible. Their traditional worry is not having the money to build the infrastructure needed as new homes cause population growth. However, for construction dependent economies like the Inland Empire, the choice appears to be temporarily foregoing such funding, or finding a broader source of infrastructure financing. Otherwise, they must face the reality of a multi-year deep recession with double digit unemployment.
John Husing, Phd. is president of Economics & Politics, Inc. based in Redlands, CA
- Housing demand plunged.
- Login to post comments
 Email this Story


Unemployment rates increased
Unemployment rates increased in many parts of the world especially in the USA since the recession begun. Unemployment isn't pleasant to think about, and is very unpleasant to endure. Some sildenafil people wonder just where unemployment is the worst. Well, I can tell you which cities that unemployment is the highest in the U.S. El Centro, in southern California, has 25.1% unemployment.
Unemployment in US escalates
A lot of economic dilemmas were brought about by the recent economic situation. As observed, unemployment rate continues to surge on many parts of the state since recession starts. The economic situation resulted to many job losses, recessions, and foreclosures. Unemployment rates increased in many parts of the world especially in the USA since the recession begun. Unemployment isn't pleasant to think about, and is very unpleasant to endure. Some people wonder just where unemployment is the worst. Well, I can tell you which cities that unemployment is the highest in the U.S. El Centro, in southern California, has 25.1% unemployment. (To be fair, most work there is seasonal agriculture.) Merced, California, is just over 20%. Yuba City, also California, sits at 19.5%. The only non California city hit with high joblessness is Elkhart-Goshen, Indiana, with 18.8%of people living off credit cards during this recession. California's stats are inflated due to seasonal unemployment, as it revolves around farming. Still, that's a lot of people that can't get payday loans due to unemployment.