David King has a point. In an article entitled "Why Public Transit Is Not Living Up to Its Social Contract: Too many agencies favor suburban commuters over inner-city riders," King, an assistant professor of urban planning in the Graduate School of Architecture, Planning and Preservation at Columbia University notes that transit spends an inordinate share of its resources on suburban riders, short changing the core city riders who cost transit agencies far less to serve and are also far more numerous. He rightly attributes this to reliance on regional (metropolitan area) funding initiatives. Many in transit think it is necessary to run near empty buses in the suburbs to justify the use of transit taxes to suburban voters (what I would refer to as "showing the transit flag")
King asks: "So does public transit serve its social obligations?" He answers: "Increasingly the answer is no." King is rightly concerned about the disproportionate growth in spending on commuter rail lines that carry transit's most affluent riders from deep in the suburbs to downtown. Transit policy has long been skewed in favor of the more affluent suburban dwellers in the United States.
My Experience in Los Angeles
I saw this first-hand as a member of the Los Angeles County Transportation Commission (LACTC). When we placed what was to become the first regional transit tax on the ballot (Proposition A in 1980), the shortage of transit service was critical in the highest demand, largely low-income areas of Los Angeles such as Los Angeles and East Los Angeles. I described the situation in a presentation to the annual conference of the American Public Transportation Association: "Often waiting passengers are passed at bus stops by full buses" Approximately 40 percent of the local bus services between the Santa Monica Mountains, Inglewood, Compton, Montebello and Santa Monica reached peak loads of 70 passengers, well above seating capacity
At the same time, suburban area buses were usually less than half-full. In connection with this concern, I produced a policy paper, Distribution of Public Transit Subsidies in Los Angeles County, which was published in by the Transportation Research Board. The abstract follows:
"Public transit today is faced with the challenge of serving its clientele while subsidies are failing to keep pace with increasing operating costs. In Los Angeles County, there are service distribution inequalities--overcrowding and unmet demand in some areas and, at the same time, surplus capacity in other areas. To use subsidy resources efficiently requires that the effects of present subsidy allocation practices be understood--that is, how subsidies are translated into consumed service, both by type of service and by geographic sector within the urban area. An attempt is made to provide a preliminary understanding of that distribution in Los Angeles County. It is postulated that significantly more passengers are carried per dollar of subsidy in the central Los Angeles area than in other areas and local services require a lower subsidy per passenger than do express services. A number of policy issues are raised, the most important being the very purpose of public transit subsidies."
Generally, transit operating subsidies per passenger were far higher in the suburbs than in the central area (where incomes are the lowest, and poverty rates the highest), and subsidies were much higher for commuter express services than for local bus services.
I attempted to address this problem by proposing a "Mobility Policy" that would have reallocated service based on customer needs, giving precedence to areas where mobility was restricted due to limited automobile availability and lower incomes. Some colleagues whose constituents were disadvantaged by this inequity objected, feeling compelled, it appeared, to rally about the “transit flag”
On a Siding: Transit Policy in Recent Decades
Since that time, Los Angeles and other major metropolitan areas have built expensive rail and busway systems. Despite the promises of attracting people out of their cars (routinely invoked during election campaigns for higher taxes), the reality is that single occupant commuting has risen from 64 percent in 1980 to 76 percent in 2012. Over the same period, transit's share of urban travel has fallen, though stabilized in recent years at very low levels in most metropolitan areas. Indeed, when New York, Chicago, Philadelphia, Washington, Boston, and San Francisco are excluded (with their "transit legacy cities"), the 46 major metropolitan areas have a transit commute share of just three percent. Overall, more people work at home than commute by transit in 38 of these metropolitan areas and more people walk or cycle to work in 27, according to American Community Survey 2012 data.
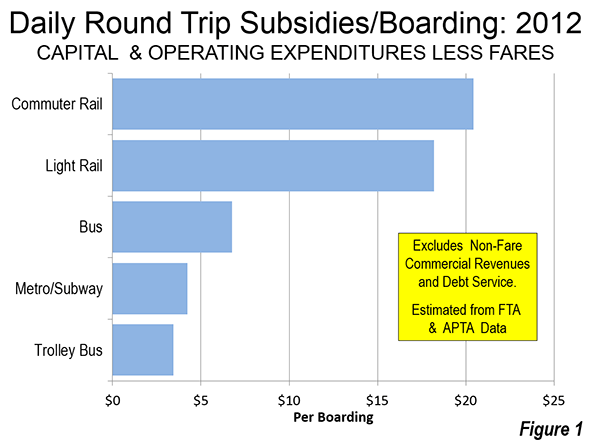
Yet the politically driven inequality in transit spending continues. Transit subsidies continue to be far higher for services that are patronized by more affluent riders. For example, subsidies (operating and capital expenditures minus fares) are three times as high for the commuter rail services, with their higher income riders, than for buses, with their lower income riders (Figure).
The difference can be stark, as an example from the New York area indicates. A Fairfield County, Connecticut commuter rail rider with the median family income of $102,000 would be subsidized to the extent of $4,500 per year (assuming the national subsidy figure). By comparison a worker from the Bronx or Hudson County, New Jersey, with a poverty level family income of $18,500 per year (or less) would be subsidized only $1,500 per year. In fact, the bus subsidy would likely be even lower, because transit in lower income areas is much better patronized and thus less costly for the public. My Los Angeles research found inner city services to be subsidized approximately half below the average of all bus services (Note).

Where Transit Works
The functional urban cores contain the nation's largest downtowns (central business districts). Their population densities are nearly five times that of the older suburbs and nine times that of the newer suburbs. The functional urban cores have transit market shares six times that of the older suburbs and 15 times that of the newer suburbs. Yet, it is in these poorer, denser areas where overcrowding is most acute and the need for more service is most acute. In Los Angeles, for example, the greatest potential for increasing transit ridership is where ridership is already highest.
The vast majority of suburban drivers are not plausible candidates for transit, simply because it cannot compete well with automobiles, except, for example, for some trips to the downtowns of the six transit legacy cities (which account only one of seven jobs in their respective metropolitan areas).
Where transit makes sense, people ride. Where it doesn't, they don't. Allocating resources inconsistent with this reality impairs the mobility of lower income residents, wastes resources and relegates transit to an inferior role in the city. Charging the affluent fares well below the cost of service compromises opportunities to serve more people in the community.
Better allocation of transit resources would likely improve core area unemployment rates by increasing the number of jobs that can be accessed by lower income workers. Further, because the better used services would require lower subsidies, there would be funding available for additional service expansions.
The principal fault is not that of transit management. It's the politics.
-----
Note: These data (expenditures per boarding) are estimated from Federal Transit Administration and American Public Transportation Association data for 2012. Commercial revenues other than fares are excluded (the most important such source is advertising). Debt service is also excluded because it is not reported in the annual reports of either organization. The subsidy ratios between lower income and more affluent riders would be changed by including transfers (though the subsidies would still be considerably higher for the more affluent). Some low income riders use more than one bus or rail vehicle for their trip, while some commuter rail riders transfer to bus or rail services at one or both ends of their trips. No readily available data is available to make such an adjustment. The New York area example assumes 225 round trips per year.
-----
Wendell Cox is principal of Demographia, an international public policy and demographics firm. He is co-author of the "Demographia International Housing Affordability Survey" and author of "Demographia World Urban Areas" and "War on the Dream: How Anti-Sprawl Policy Threatens the Quality of Life." He was appointed to three terms on the Los Angeles County Transportation Commission, where he served with the leading city and county leadership as the only non-elected member. He was appointed to the Amtrak Reform Council to fill the unexpired term of Governor Christine Todd Whitman and has served as a visiting professor at the Conservatoire National des Arts et Metiers, a national university in Paris.
Photo: Bart A car Oakland Coliseum Station


