Net migration of people to or from metro areas is reported annually by the Census Bureau and widely discussed. Less well known is that their American Community Survey (ACS) provides migration figures broken down by characteristics such as race, age, income, and educational attainment. This lets us drill into finer grained details about who is moving where.
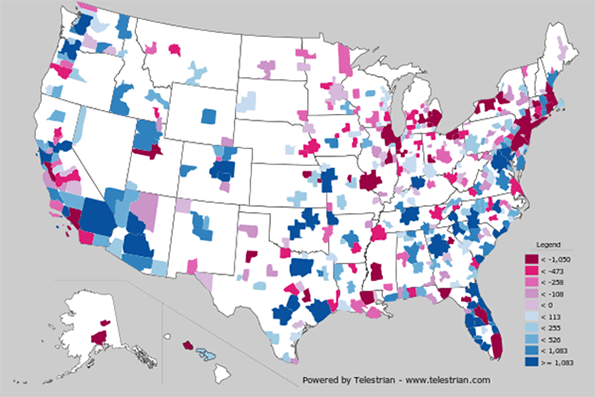
Here is a map of net migration of people with a bachelor’s degree or higher, based on data from the 2007-2011 ACS, with blue indicating net migration gains and red net migration losses:

Net domestic migration of adults age 25+ with a bachelor’s degree or higher by metropolitan area. Source: 2007-2011 ACS with rollups and mapping via Telestrian
Unsurprisingly, this data correlates with overall net migration. For example, at first glance it might seem odd that a metro area like New York would be a net loser of people with college degrees. It lost a net of nearly 29,000 of them, highest net outflow in the country. But the New York metro as a whole lost almost two million people to domestic migration during the 2000s. Given that, it would be surprising indeed if the region didn’t lose people with degrees. It’s similar for runners-up in the loss department Los Angeles (-11,000) and Chicago (-9,500).
The list of leaders is unsurprisingly headed by Austin, Texas (+9,500), Dallas (+9,200) and Phoenix (+9,200) and other population boomtowns. But there are some areas that punch above their weight versus overall migration, such as #5 Portland (+7000) and #9 Washington, DC (+5000). These cities are known as talent magnets and this data points in that direction. Their net in-migration is disproportionately highly educated.
I have rounded the numbers above because this data is based on samples with a margin of area. Keep in mind when reviewing the tables below with detailed statistics not to read into this a false degree of precision.
Regions like New York, Los Angeles, and Chicago can take heart from the fact that they are still among the top destinations of in-migrants with college degrees.
|
Rank |
Metro Area |
In-Migrants |
|
1 |
New York-Newark-Jersey City, NY-NJ-PA |
79,156 |
|
2 |
Washington-Arlington-Alexandria, DC-VA-MD-WV |
74,048 |
|
3 |
Los Angeles-Long Beach-Anaheim, CA |
66,209 |
|
4 |
San Francisco-Oakland-Hayward, CA |
49,980 |
|
5 |
Chicago-Naperville-Elgin, IL-IN-WI |
49,016 |
|
6 |
Dallas-Fort Worth-Arlington, TX |
47,198 |
|
7 |
Atlanta-Sandy Springs-Roswell, GA |
44,892 |
|
8 |
Boston-Cambridge-Newton, MA-NH |
42,006 |
|
9 |
Houston-The Woodlands-Sugar Land, TX |
37,408 |
|
10 |
Phoenix-Mesa-Scottsdale, AZ |
36,349 |
Domestic In-Migration, Adults 25+ with a bachelor’s degree or higher. Source: 2007-2011 ACS with rollups and analysis via Telestrian
Unfortunately for them, even higher numbers of people left.
|
Rank |
Metro Area |
Out-Migrants |
|
1 |
New York-Newark-Jersey City, NY-NJ-PA |
108,118 |
|
2 |
Los Angeles-Long Beach-Anaheim, CA |
77,190 |
|
3 |
Washington-Arlington-Alexandria, DC-VA-MD-WV |
69,179 |
|
4 |
Chicago-Naperville-Elgin, IL-IN-WI |
58,680 |
|
5 |
San Francisco-Oakland-Hayward, CA |
47,201 |
|
6 |
Boston-Cambridge-Newton, MA-NH |
45,407 |
|
7 |
Atlanta-Sandy Springs-Roswell, GA |
40,363 |
|
8 |
Philadelphia-Camden-Wilmington, PA-NJ-DE-MD |
38,640 |
|
9 |
Dallas-Fort Worth-Arlington, TX |
37,958 |
|
10 |
Miami-Fort Lauderdale-West Palm Beach, FL |
34,191 |
Domestic Out-Migration, Adults 25+ with a bachelor’s degree or higher. Source: 2007-2011 ACS with rollups and analysis via Telestrian
This in part reflects the status of America’s tier one cities as talent refineries. People move there after school when young, but then leave after they get older and have been upskilled by their experiences – and when their life priorities change. We should expect cities like New York to have a lot of churn.
A place like New York can also take solace in the fact that its migration loss of the college degreed was better than for those with lesser educational attainment. Metro New York has 37% college degree attainment, but college grads only accounted for 28% of net migration losses. This is good news from the standpoint of retaining highly educated people, but raises the question of why New York is not so attractive to those without degrees.
While each metro area has its own nuanced story to tell in migration, on the whole this report shows that the migration of the educated overall appears to be following that of the population as a whole. This means increasing numbers of people with college degrees moving to lower-cost Sunbelt boomtowns and other metros with rapidly expanding populations.
Here is a complete ranking of net migration for adults with college degrees for all metro areas greater than one million people.
|
Rank |
Metro Area |
Net Migrants |
|
1 |
Austin-Round Rock, TX |
9,384 |
|
2 |
Dallas-Fort Worth-Arlington, TX |
9,240 |
|
3 |
Phoenix-Mesa-Scottsdale, AZ |
9,208 |
|
4 |
Houston-The Woodlands-Sugar Land, TX |
8,015 |
|
5 |
Portland-Vancouver-Hillsboro, OR-WA |
6,933 |
|
6 |
Denver-Aurora-Lakewood, CO |
6,132 |
|
7 |
Seattle-Tacoma-Bellevue, WA |
5,935 |
|
8 |
Riverside-San Bernardino-Ontario, CA |
5,308 |
|
9 |
Washington-Arlington-Alexandria, DC-VA-MD-WV |
4,869 |
|
10 |
Raleigh, NC |
4,674 |
|
11 |
Tampa-St. Petersburg-Clearwater, FL |
4,665 |
|
12 |
San Antonio-New Braunfels, TX |
4,542 |
|
13 |
Atlanta-Sandy Springs-Roswell, GA |
4,529 |
|
14 |
Charlotte-Concord-Gastonia, NC-SC |
4,096 |
|
15 |
San Francisco-Oakland-Hayward, CA |
2,779 |
|
16 |
Jacksonville, FL |
2,113 |
|
17 |
Kansas City, MO-KS |
2,072 |
|
18 |
Nashville-Davidson--Murfreesboro--Franklin, TN |
2,069 |
|
19 |
Sacramento--Roseville--Arden-Arcade, CA |
1,816 |
|
20 |
Louisville/Jefferson County, KY-IN |
1,647 |
|
21 |
Oklahoma City, OK |
1,189 |
|
22 |
Baltimore-Columbia-Towson, MD |
1,157 |
|
23 |
New Orleans-Metairie, LA |
985 |
|
24 |
Richmond, VA |
931 |
|
25 |
Birmingham-Hoover, AL |
905 |
|
26 |
Salt Lake City, UT |
844 |
|
27 |
Las Vegas-Henderson-Paradise, NV |
745 |
|
28 |
Pittsburgh, PA |
179 |
|
29 |
Cincinnati, OH-KY-IN |
32 |
|
30 |
Indianapolis-Carmel-Anderson, IN |
2 |
|
31 |
Minneapolis-St. Paul-Bloomington, MN-WI |
(46) |
|
32 |
Columbus, OH |
(343) |
|
33 |
San Diego-Carlsbad, CA |
(476) |
|
34 |
Virginia Beach-Norfolk-Newport News, VA-NC |
(610) |
|
35 |
Milwaukee-Waukesha-West Allis, WI |
(723) |
|
36 |
Hartford-West Hartford-East Hartford, CT |
(749) |
|
37 |
Memphis, TN-MS-AR |
(928) |
|
38 |
Buffalo-Cheektowaga-Niagara Falls, NY |
(1,139) |
|
39 |
St. Louis, MO-IL |
(1,199) |
|
40 |
Miami-Fort Lauderdale-West Palm Beach, FL |
(1,225) |
|
41 |
Rochester, NY |
(1,295) |
|
42 |
Providence-Warwick, RI-MA |
(1,366) |
|
43 |
Cleveland-Elyria, OH |
(1,563) |
|
44 |
San Jose-Sunnyvale-Santa Clara, CA |
(1,825) |
|
45 |
Orlando-Kissimmee-Sanford, FL |
(2,603) |
|
46 |
Boston-Cambridge-Newton, MA-NH |
(3,401) |
|
47 |
Philadelphia-Camden-Wilmington, PA-NJ-DE-MD |
(4,127) |
|
48 |
Detroit-Warren-Dearborn, MI |
(9,472) |
|
49 |
Chicago-Naperville-Elgin, IL-IN-WI |
(9,664) |
|
50 |
Los Angeles-Long Beach-Anaheim, CA |
(10,981) |
|
51 |
New York-Newark-Jersey City, NY-NJ-PA |
(28,962) |
Aaron M. Renn is an independent writer on urban affairs and the founder of Telestrian, a data analysis and mapping tool. He writes at The Urbanophile.


Thank you for this nice article
This article gives the light in which we could see the reality. This can be very nice one and gives indepth information. Thank you for this nice article sites
Migration by race?
Is there recent information on migration by education and race/ethnicity?
Thanks,
Robert Reichardt
Annual numbers?
Are these annual numbers--and if so for what year? Or are they annualized averages over the period 2007-11? Or are they total numbers over the period 2007-11?
Also, these numbers are absolutes rather than percentages. So of course NYC is at the top (bottom) of the list--it simply has more people. If it were displayed as percentages it would be more interesting. Though as a percentage of what I'm not sure: per college educated, or per total population?
Is there a net migration away from college towns? It looks a bit like that to me. Look at Boston, or Eugene, OR. In that case maybe a sources and sinks model is the best way to think of this. College grads migrate from where they are to where they are not.
For all that, I think a college degree is of decreasing economic importance these days, except perhaps as a signal of IQ and work ethic.
I forgot to add one thing -
I forgot to add one thing - this is out of the population 25+, so college towns are probably less afffected than you might think.
These are raw numbers. If
These are raw numbers. If you wanted to present them as a migration rate, you could. But I'd dispute that simply because New York is the largest metro, it should have the highest net out migration. One could easily make the argument it should have the highest net in migration. Also, I've noticed from other data sets that migration rate seems to decline with region size.
I'd say it's likely college towns show higher net out migration as they import people without degrees and export them with degrees. Nothing wrong with that. They are functioning as designed.
This data is from the 5-year ACS. My understanding is that this should be conceptually viewed as a one year average value, though that's not literally what it is. It's not a five year total.
Your comment above touches
Your comment above touches on this, but the information in the article would be much more interesting if you had counts and statistical information on:
- college students and graduate students who enrolled in colleges and universities within the respective metro areas
- breakdown of students each year who hailed from within and outside of each area
- students that graduated, and stayed in those areas
- graduated and departed
I suspect that some of these 'imbalances' in retention of degreed residents in some of the major cities may be driven, or at least exaggerated, by the difficulty of tracking students and recent graduates. Increasingly, I suspect that the schools located in desirable areas in major cities may have a competitive advantage in growing their student enrollment, and in attracting an ambitious applicant pool. It's well understood that cities with major student populations and vibrant city life have a far superior post-graduation retention rate than smaller college towns.
Robert
If you try to get a work
If you try to get a work permit and stay for more years then you can apply for indefinite leave to remain (legal settlement).http://www.chiefpapers.com