
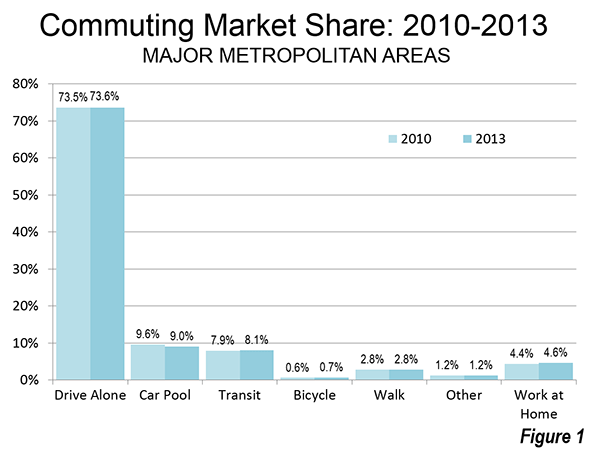
The newly released American Community Survey data for 2013 indicates little change in commuting patterns since 2010, a result that is to be expected in a period as short as three years. Among the 52 major metropolitan areas (over 1 million population), driving alone increased to 73.6% of commuting (including all travel modes and working at home). The one mode that experienced the largest drop was carpools, where the share of commuting dropped from 9.6% in 2010 to 9.0% in 2013. Doubtless most of the carpool losses represented gains in driving alone and transit. Transit grew, increasing from a market share of 7.9% in 2010 to 8.1% in 2013 in major metropolitan areas; similarly working at home increased from 4.4% to 4.6%, an increase similar to that of transit (Figure 1). Bicycles increased from 0.6% to 0.7%, while walking remained constant at 2.8%.
Transit: Historical Context
Transit has always received considerable media attention in commuting analyses. Part of this is because of the comparative labor efficiency (not necessarily cost efficiency) of transit in high-volume corridors leading to the nation's largest downtown areas. Part of the attention is also due to the "positive spin" that has accompanied transit ridership press releases. An American Public Transportation Association press release earlier in the year, which claimed record ridership, have evoked a surprisingly strong response from some quarters: For example, academics David King, Michael Manville and Michael Smart wrote in the Washington Post:"We are strong supporters of public transportation, but misguided optimism about transit’s resurgence helps neither transit users nor the larger traveling public." They concluded that transit trips per capita had actually declined in the past 5 years.
Nonetheless, transit remains well below its historic norms. The first commute data was in the 1960 census and indicated a 12.6% national market share for transit for the entire U.S. population. By 1990, transit's national market share had dropped to 5.1%. After dropping to 4.6% in 2000, transit recovered to 5.2% in 2012. But clearly the historical decline of transit's market share has at least been halted (Figure 2).
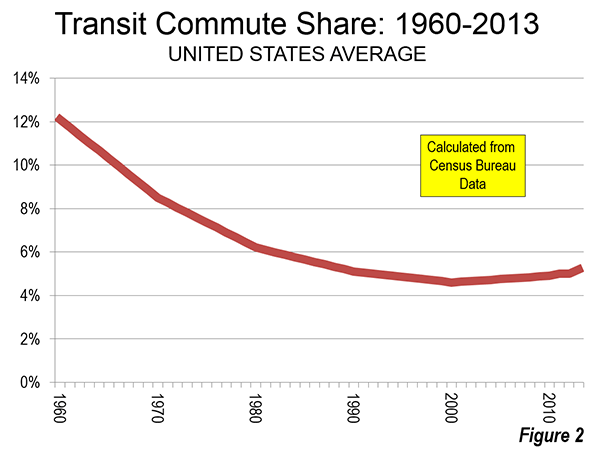
Even so, in a rapidly expanding market, many more people have begun driving alone than using transit. More than 47 million more commuters drive alone today than in 1980, while the transit increased about 1.4 million commuters over the same time period.
The largest decline occurred before 1960. Transit's work trip market share was probably much higher in 1940, but the necessary data was not collected in the census, just before World War II and the great automobile-oriented suburbanization. In 1940, overall urban transit travel (passenger miles all day, not just commutes) is estimated to have been twice that of 1960 and nearly 10 times that of today.
Transit's 2010-2013 Trend
To a remarkable extent, transit continues to be a "New York story." Approximately 40% of all transit commuting is in the New York metropolitan area. New York's 2.9 million transit commuters near six times that of second place Chicago. Transit accounts for 30.9% of commuting in New York. San Francisco ranks second at 16.1% and Washington third at 14.2%. Only three other cities, Boston (12.8%), Chicago (11.8), and Philadelphia (10.0%) have transit commute shares of 10% or more.
From 2010 to 2013, transit added approximately 375,000 new commuters. Approximately 40% of the entire nation's transit commuting increase occurred in the New York metropolitan area. This was included in the predictable concentration (80%) of ridership gains in the transit legacy metropolitan areas, which are the six with transit market shares of 10% or more. Combined, these cities added 300,000 commuters, 89%, on the large rail systems that feed the nation's largest downtown areas.
Perhaps surprisingly, Seattle broke into the top five, edging out legacy metropolitan areas (Figure 3) Philadelphia and Washington. Seattle has a newer light rail and commuter rail system. Even so, the bulk of the gain in Seattle was not on the rail system. Approximately 80% of its transit commuter growth was on non-rail modes. Seattle has three major public bus systems, a ferry system and the newer Microsoft private bus system that serves its employment centers throughout the metropolitan area. All of the new transit commuters in eighth ranked Miami were on non-rail modes, despite its large and relatively new rail system. New rail city Phoenix (10th) also experienced the bulk of its new commuting on non-rail modes (93%). Rail accounted for most of the gain in San Jose (9th), with a 58% of the total The transit market shares in Miami, San Jose and Phoenix are all below the national average of 5.2%.
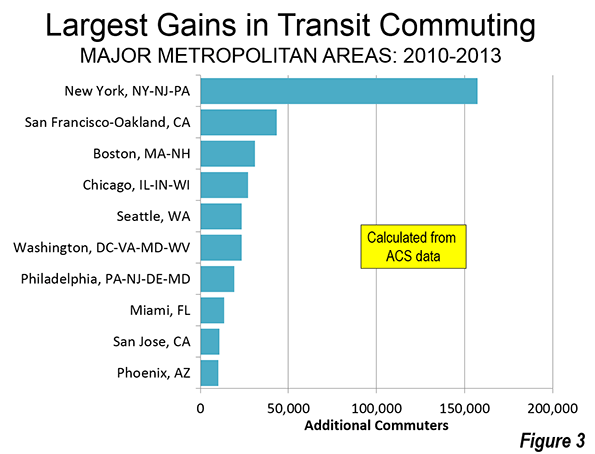
Outside the six transit legacy metropolitan areas, gains were far more modest, at approximately 75,000. Seattle, Miami, San Jose, and Phoenix accounted for nearly 60,000 of this gain, leaving only 15,000 for the other 42 major metropolitan areas, including Los Angeles, which had a 5,000 loss. Los Angeles now has a transit work trip market share of 5.8%, below the 5.9% in 1980 when the Los Angeles County Transportation Commission approved the funding for its rail system (the result of my amendment, see "Transit in Los Angeles"). Los Angeles is falling far short of its Matt Yglesias characterization as the "next great mass-transit city."
Since 2000, the national trend has been similar. Nearly 80% of the increase in transit commuting has been in the transit legacy metropolitan areas, where transit's share has risen from 17% to 20%. These areas accounted for only 23% of the major metropolitan area growth since 2000. By contrast, 77% of the major metropolitan area growth has been in the 46 other metropolitan areas, where transit's share of commuting has remained at 3.2% since 2000. There are limits to how far the legacy metropolitan areas can drive up transit's national market share.
Prospects for Commuting
At a broader level, the new data shows the continuing trend toward individual mode commuting, as opposed to shared modes. Between 2010 and 2013, personal modes (driving alone, bicycles, walking and working at home) increased from 82.3% to 82.7% of all commuting. Shared modes (carpools and transit) declined from 17.7% of commuting to 17.3%. These data exclude the "other modes" category (1.2% of commuting) because it includes both personal and shared commuting. None of this should be surprising, since one of the best ways to improve productivity, both personal and in the economy, is to minimize travel time for necessary activities throughout the metropolitan area (labor market).
Wendell Cox is principal of Demographia, an international public policy and demographics firm. He is co-author of the "Demographia International Housing Affordability Survey" and author of "Demographia World Urban Areas" and "War on the Dream: How Anti-Sprawl Policy Threatens the Quality of Life." He was appointed to three terms on the Los Angeles County Transportation Commission, where he served with the leading city and county leadership as the only non-elected member. He was appointed to the Amtrak Reform Council to fill the unexpired term of Governor Christine Todd Whitman and has served as a visiting professor at the Conservatoire National des Arts et Metiers, a national university in Paris.
Photograph: DART light rail train in downtown Dallas (by author)


