
A recent New York Times Magazine had a story on Portland that featured Yours Truly. I recapitulated a few observations I’ve had over the years, including that it’s truly remarkable how a small city like Portland has captured so many people’s imagination, and also that “people move to Portland to move to Portland.”
A Portland writer named Steve Duin appears to have had an aneurysm over the piece and, among other things, criticized my statement about why people move to Portland, saying:
She quotes Aaron Renn, an urban-affairs analyst, who insists that while Los Angeles attracts starlets and New York the financiers, “People move to Portland to move to Portland,” as if the city is a space between Pacific Avenue and Park Place on the Monopoly board, not a vibrant, creative, accessible and accommodating urban scene.
Which only proves that he completely missed the point. All I’m saying is what he’s saying in different words, namely that people move to Portland for its lifestyle and amenities. This is exactly what every Portland booster claims, namely that what they’ve created is attractional. I’m simply pointing out the obvious: people move to Portland primarily for lifestyle and leisure, not career or economic reasons. People move to Portland because they want to live there.
Portland’s economy has actually picked up of late. Its unemployment fell below the national average in 2013 after having been above it for 14 straight years. But I want to highlight a disconnect between a couple measures of economic performance.
I’ve written many times that Portland has done very well in terms of per capita GDP. In fact, from 2001 to 2013 (the maximum range of data available from the feds), Portland was #1 out of all 52 large metros in the US in its percentage increase in real per capita GDP.
On the other hand, looking at how much of that economic value ends up in people’s pockets tells a different story. From 2001 to 2012 (I don’t think 2013 has been released yet), Portland only ranked 40th out of 52 in its percentage increase on this metric. Portland declined from a per capita income of 104.9% of the US average in 2001 to 98.6% in 2012.
I threw this divergence into a quick chart:
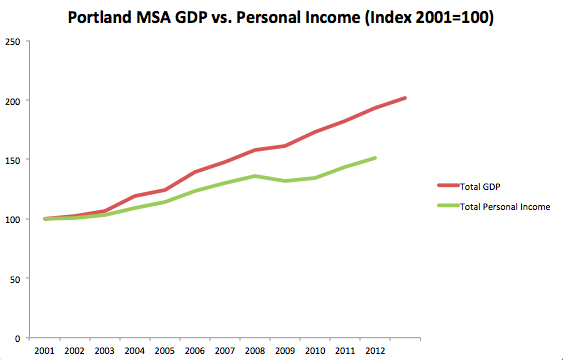
It would be interesting to dig into these numbers. I did a quick back of the envelop calculation of total GDP growth by industry. Only a few industry totals are available, but the biggest gainer was Manufacturing, up 300%. Education, Health, and Social Assistance were #2, followed by Professional and Business Services. Natural Resources, Retail. Information, and FIRE were at the bottom.
Speaking of San Jose, I see an even more remarkable divergence there. It was #2 in per capita GDP growth over the 2001-2013 time frame. Looking at the overall Bay Area total real GDP, it increased by 30.1% from 2001 to 2013. Keep in mind I’m using the inflation adjusted figured here, so there’s no inflation in that metric. But at the same time the Bay Area lost 2.4% of its jobs.
The Bay Area grew its economy by almost a third while shedding over 75,000 jobs. Pretty remarkable.
Aaron M. Renn is an independent writer on urban affairs and the founder of Telestrian, a data analysis and mapping tool. He writes at The Urbanophile, where this piece originally appeared.
"Portland Oregon" by Jamidwyer - Own work. Licensed under Public domain via Wikimedia Commons


