
Last year (2014), China overtook the United States in gross domestic product adjusted for purchasing power (GDP-PPP, see point 4 for explanation), according to both the International Monetary Fund (IMF) and the World Bank (Note 1). It may come as a surprise, but this is really a matter of China simply reasserting its position as the world's largest economy, which it had lost around 1890 to the United States. This is based on estimates developed by the late legendary economist Angus Maddison of the Organization for Economic Cooperation and Development (OECD).
Over the 515 years from 1500 to 2015, the available data seems to suggest that the largest economy in the world almost always been either China or the United States. The one exception indicated was in 1700, when India had the highest GDP (for most years there is only incomplete data). This article provides highlights of GDP PPP data in US$2015 (Note 2), beginning less than a decade after Columbus "discovered America" and less than 70 years after the last great pre-Columbian Chinese sailing expedition, led by Admiral Zheng He. Maddison's data is used and adjusted to 2015$ through 1970, with IMF data used for 1980 to 2015.
Further, in the earlier years, virtually all nations had very low GDPs per capita. This was to begin changing with the industrial revolution. Thus, the early data can be characterized as being strongly related to population, because there was much less difference in GDP per capita based on level of development.
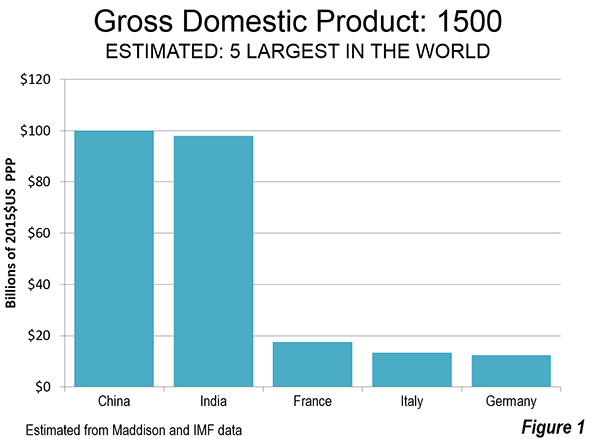
1500: In 1500, China was the largest economy in the world, followed closely by India, both with estimated GDP's of approximately $100 billion. France was a distant third at approximately 18 billion, followed closely by Italy and Germany. What is now the United Kingdom ranked 10th, at barely one quarter the output of France (Figure 1).
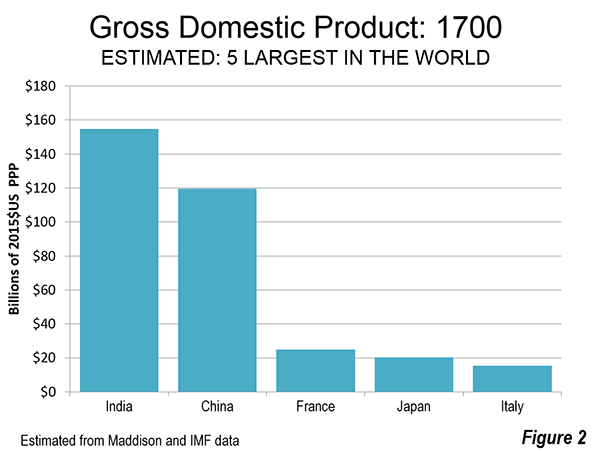
1700: This was the only reported year between 1500 and 2015 that China or the United States did not lead the world. India had the strongest economy in 1700, closely followed by China. Throughout the entire period to the middle of the 20th century, China's economy was larger than India's by a relatively small margin. At the same time “the great powers” of the West were still well behind China and India, with France retaining third-place with a GDP less than one fourth that of China and 1/6 that of India. The United Kingdom was yet to break into the top five, ranking eighth (Figure 2).
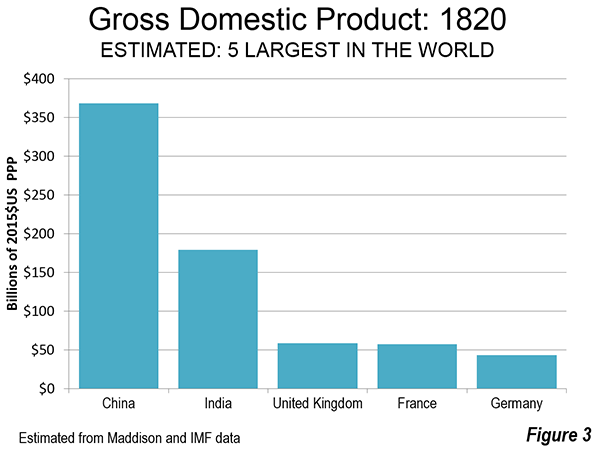
1820: By 1820, the next year for which full data is available, China resumed its lead and by a larger margin. India was second, slightly more than one half that of China. The United Kingdom finally appears, in third-place with a GDP one sixth that of China and only slightly ahead of France (Figure 3). The available data shows China to have retained the top position through 1870.
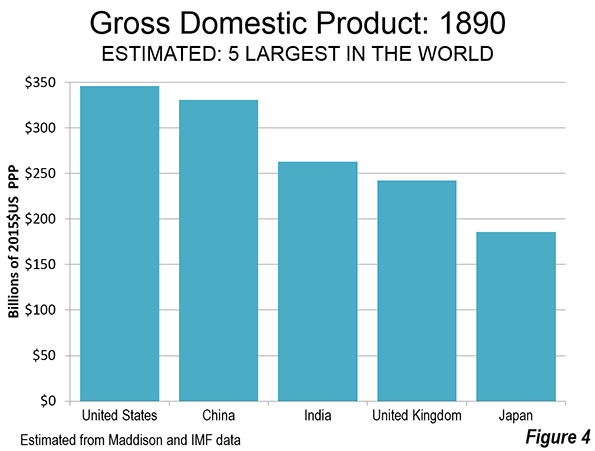
1890: By 1890, the United States had emerged as the world's largest economy, opening up an approximately five percent lead over China. India ranked third, followed by the United Kingdom and Japan (Figure 4).
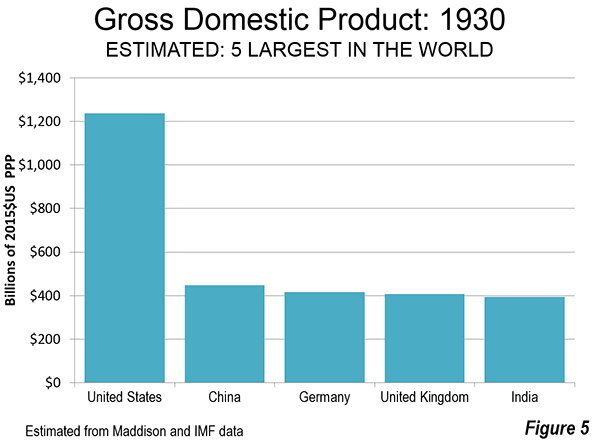
1930: By 1930, the ascendancy of the United States was clear. China, then reeling from social disorder and civil strife, still remained the second largest economy, but trailed the United States by approximately two thirds. There was little difference between China and the next three largest economies, Germany, the United Kingdom and India (Figure 5).
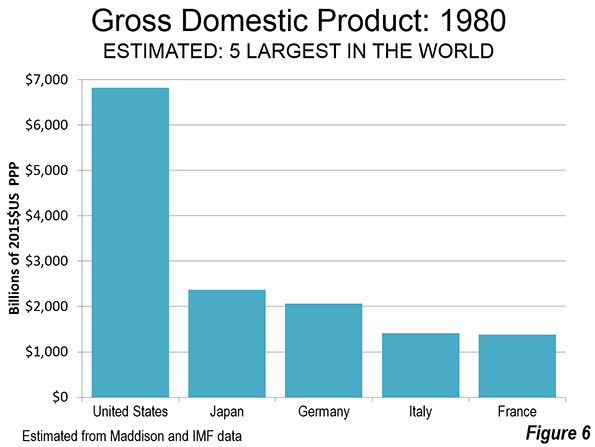
1980: Half a century later, in 1980, the United States retained a similar lead, but now over second-ranked Japan. Germany was a close third, followed by Italy and France. India ranked ninth, approximately 30 percent ahead of 10th ranked China. Then the Deng Xiaoping era was getting underway (Figure 6), leading to China’s resurgence back towards the top.
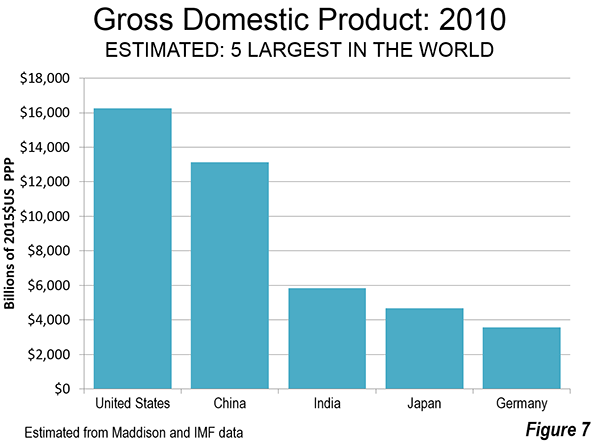
2010: China's ascendancy was obvious by 2010, reaching within 20 percent of the United States, which remained number one. This had been a dramatic reversal, since China's GDP had been little more than one tenth that of the United States only 30 years earlier (1980). India was also restored to a leadership position, ranking third. Japan was fourth and Germany was fifth (Figure 7).
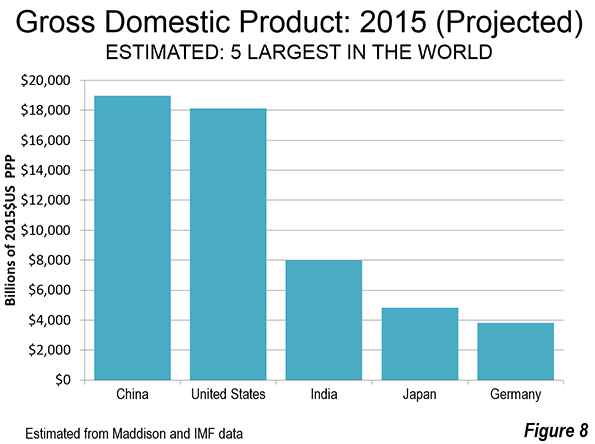
2015: The 2015 IMF projections show China to have recovered first-place after at least a 125 year hiatus. The United States was second, approximately four percent behind China. India, Japan and Germany remained in third, fourth and fifth place (Figure 8). The BRIIC developing nations are in the top 10, with Russia, Brazil and Indonesia ranking sixth through eighth (in addition to China and India in first and third place). Two other powers of Europe round out the top 10, the United Kingdom and France.
Observations
The impact of China's difficult 19th century is indicated by a 10% GDP decline, despite an increasing population. It seems likely that this is at least partially attributable to the Opium Wars, treaty ports and related extraterritorial jurisdiction by external powers. China's GDP in 1900 had fallen 10 percent from its 1820 level.
It is notable that through much of their empire-colonial relationship between the United Kingdom and India, the colony had the larger GDP. This was the case from 1820 through 1900. This is principally due to the larger population of India. For example, in 1870, India's GDP was one-third larger than that of the United Kingdom. In the same year, however, the UK GDP per capita was six times that of India.
Similarly, while China's GDP is larger than that of the United States in GDP, its GDP per capita is about one-fourth that of the US.
Projections
GDP projections produced for 2050, by PWC (Price Waterhouse Coopers) indicate that even more significant changes could be ahead. PWC expects China to have GDP of $61 trillion (US$2014). India is projected to be restored to its previous second place, at $42 trillion, just ahead of the United States ($41 trillion). BRIICs members Indonesia and Brazil would be 4th and 5th, while BRIICs Russia would be 8th. Mexico and Japan would follow Brazil, with Nigeria and Germany rounding out the top ten.
If PWC is right, the dominance of China and the United States might be supplanted by the historically dominant duo of China and India. Of course, no one knows for sure. Forecasting economics is even harder than forecasting population.
--------------------
Note: All data is converted into 2015 international dollars using the US GDP implicit price deflator. US
dollars are the basis of international dollars.
Photo: Zheng He Park, Nanjing (by author)
--------------------
Wendell Cox is Chair, Housing Affordability and Municipal Policy for the Frontier Centre for Public Policy (Canada), is a Senior Fellow of the Center for Opportunity Urbanism (US), a member of the Board of Advisors of the Center for Demographics and Policy at Chapman University (California) and principal of Demographia, an international public policy and demographics firm.
He is co-author of the "Demographia International Housing Affordability Survey" and author of "Demographia World Urban Areas" and "War on the Dream: How Anti-Sprawl Policy Threatens the Quality of Life." He was appointed to three terms on the Los Angeles County Transportation Commission, where he served with the leading city and county leadership as the only non-elected member. He served as a visiting professor at the Conservatoire National des Arts et Metiers, a national university in Paris.


