
This is a new report brief from the Center for Population Dynamics at Cleveland State University, download the pdf version here. The report was authored by Richey Piiparinen, Jim Russell, and Charlie Post.
In 1963, nearly 75% of America’s top 50 companies owned and extracted natural resources1. By 2013, only 20% of top firms were natural resource-based. Today, knowledge-focused industries such as IBM comprise over 50% of America’s top 50 firms. Translation: talent is the new oil.
But not every region has reservoirs of human capital. Historically, knowledge economies have gathered in select top-tier metros, termed “Islands of Innovation”2. Think Boston and San Francisco. There are numerous reasons for this, including access to select research institutions, as well as the productivity effects that arise when a cluster economy is formed3.
For scholars such as economist Enrico Moretti, this “Great Divergence”4 between “the best” and “the rest” will continue. “More than traditional industries,” writes Moretti in his book The New Geography of Jobs, “the knowledge economy has an inherent tendency toward geographical agglomeration.”
But is this trend inevitable? Will the divergence remain? One line of thought is that the cost of living in top-tier metros will inevitably lead to “capital equalization”5—loosely defined as the “convergence” between regions in job and income growth. Capital equalization was a key factor in the decline of the Rust Belt. Here, manufacturing jobs became automated or moved down South or overseas to cut labor costs. One could argue that capital equalization will re-map the geographies of the knowledge economy in a similar manner.
“The prediction of this view is the convergence of American communities,” writes Moretti. “Low-cost areas will attract more and more of the new, high-paying jobs. Cities that have been lagging behind-the Clevelands, the Topekas, and the Mobiles-will grow much faster. Bogged down by their high costs, San Francisco, New York, Seattle, and similar cities will decline.” That said, Moretti does not believe convergence is taking shape. “[T]he data don’t support this view,” Moretti continues. “In fact, the opposite has been happening.”
But there is data that do support this view, and it begins to sketch a newer geography of jobs that is enabling an increasing concentration of highly-skilled workers in America’s second-tier cities. AOL Co- Founder Steve Case has dubbed this convergence back into Middle America “the Rise of the Rest”6.
Where are America’s Highest-Skilled Jobs Clustering?
The most common measure of human capital is educational attainment, or the percent of a population with a college degree. Not all human capital is equal. Generally speaking, the higher the degree conferred, the more productive the worker, and this is reflected in pay. For example, the national median income by education level is as follows: $27,350 for a high school graduate, $50,050 for a person with a 4-year degree, and $65,565 for a person with an advanced degree7. The fact that those with a graduate or professional degree are paid highest is indicative of their productive capacity in the knowledge economy.
Specifically, a region’s highest-educated workers are likely to be job creators, not just job consumers. This primarily comes about two ways: (1) through direct job creation, such as a research doctor starting a biotech spin-off firm; and (2) through indirect job creation, particularly relating to the “downstream” effect a high- paying job has on the local service economy. Put simply, more income, more spending, equals more jobs.
What metros are experiencing the fastest growth in its concentrationof workers with advanced or professional degrees? To answer this, the analysis used data from the Current Population Survey (CPS) to compare the educational attainment rates of the nation’s largest laborforcesfrom 2005 to 2013. Of particular concern was the percentage of people in a regional labor force with an advanced or professional degree, and whether or not top-tier metros gained higher- skilled workers at a faster rate than second-tier metros. Here, the rate was calculated as the percent point change between a region’s 2013 educational attainment rate and its 2005 educational attainment rate for workers with an advanced degree.
Table 1 shows the results. In line with the Great Divergence, Washington, D.C. and San Francisco are experiencing the 1st and 4th fastest rates of change in the employment of high- skilled workers, respectively. However, three of the top five fastest-growth metros are second tier: Providence, Indianapolis, and Cleveland— each with over a 5% percent point change. While these metros cannot match the top-tier metros in the number of advanced degree jobs gained— e.g., Cleveland gained nearly 44,000 grad-level jobs compared to 157,000 for San Francisco— the data nonetheless speak to a number of second-tier metros converging, or “moving up”, into the knowledge economy hierarchy.
| Table 1 | Percentage of Workers with Advanced Degree, 2005 | Percentage of Workers with Advanced Degree, 2013 | Percent Point Change |
| Source: CPS 2005, 2013 | |||
| Washington, DC | 21.58% | 27.48% | 5.90% |
| Providence | 10.71% | 16.30% | 5.59% |
| Indianapolis | 11.63% | 17.08% | 5.45% |
| San Francisco | 17.49% | 22.88% | 5.39% |
| Cleveland | 11.68% | 17.00% | 5.32% |
| Kansas City | 10.88% | 15.49% | 4.61% |
| Jacksonville | 7.54% | 12.07% | 4.52% |
| San Antonio | 8.52% | 12.32% | 3.80% |
| Denver | 12.75% | 16.54% | 3.78% |
| Sacramento, CA | 9.07% | 12.78% | 3.72% |
| Detroit | 12.66% | 16.26% | 3.60% |
| Minneapolis | 12.30% | 15.55% | 3.25% |
| Riverside, CA | 5.08% | 8.09% | 3.01% |
| Pittsburgh, PA | 13.66% | 16.57% | 2.91% |
| Chicago | 14.70% | 17.55% | 2.84% |
| Philadelphia | 13.52% | 16.22% | 2.70% |
| Charlotte | 7.62% | 10.14% | 2.52% |
| Orlando | 9.28% | 11.73% | 2.45% |
| Boston | 21.03% | 23.41% | 2.37% |
| Seattle | 15.34% | 17.71% | 2.36% |
| Phoenix | 10.19% | 12.50% | 2.31% |
| Milwaukee | 12.32% | 13.87% | 1.55% |
| Las Vegas | 7.08% | 8.56% | 1.48% |
| Portland | 13.52% | 14.98% | 1.46% |
| New York | 17.14% | 18.56% | 1.42% |
| Columbus, OH | 12.95% | 14.35% | 1.40% |
| St. Louis | 11.91% | 13.20% | 1.29% |
| Dallas | 10.89% | 12.16% | 1.28% |
| Baltimore | 17.12% | 18.28% | 1.17% |
| Virginia Beach | 9.62% | 10.57% | 0.96% |
| Houston | 9.65% | 10.60% | 0.95% |
| Miami | 10.83% | 11.68% | 0.85% |
| San Diego | 14.27% | 15.03% | 0.75% |
| Los Angeles | 11.65% | 12.38% | 0.73% |
| San Jose | 23.33% | 23.52% | 0.20% |
| Nashville | 12.02% | 11.70% | -0.32% |
| Atlanta | 14.08% | 13.36% | -0.72% |
| Cincinnati | 10.23% | 9.22% | -1.01% |
| Tampa | 11.30% | 10.05% | -1.25% |
| Austin | 17.92% | 16.35% | -1.57% |
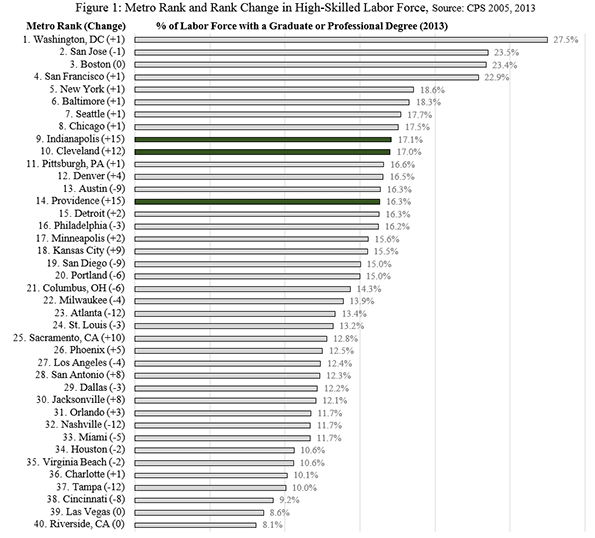
To further illustrate this point, rankings were calculated to show the metros with the highest concentration of advanced-degreed workers in the labor force for 2005 and 2013. Change rankings were then calculated to determine just how far converging metros like Cleveland and Indianapolis were rising in the knowledge economy hierarchy. Figure 1 displays the results. Notice the top of the rankings are comprised of traditional top-tier metros. Also, the change in these metro rankings from 2005 showed no variance (ranging from -1 to +1), indicating little “wiggle room” in the top echelon from 2005 to 2013. The exception, here, was Austin, which dropped 9 spots to 13th. Moreover, two metros—Indianapolis and Cleveland—moved up from the middle of the pack to rank 9th and 10th, respectively. Providence also made a large leap: from 29th in 2005 to 14th in 2013. These figures indicate there is a notable economic restructuring occurring in Indianapolis, Cleveland, and Providence that is perhaps forming a next generation of innovation nodes.
Now, in the case of Cleveland, do the results mean the gritty Rust Belt metro is experiencing robust job growth? Not exactly. From 2005 to 2013, 78% of the nearly 54,782 jobs added for college graduates in Greater Cleveland were for those with advanced degrees—meaning job growth for people with only a bachelor’s degree was sluggish at best. What’s more, job losses for Greater Clevelanders without college degrees was substantial: a decline over 83,000 jobs from 2005 to 2013. In other words, while the region’s highest-skilled workforce is converging into the ranks of the national elite, the effect has yet to be found “downstream” in direct or indirect job creation.
This is not unexpected. Specifically, economic restructuring, particularly for manufacturing-based regions, is a process, and a working theory for the Center for Population Dynamics is that a concentration of advanced-degree workers is an important leading indicator to more widespread growth8. As this line of inquiry evolves, an eventual step is to set up a policy framework so that the region’s growing concentration of high-skilled workers can be strategically catalyzed to lead to broader economic opportunities, rather than missed opportunities. The Center for Population Dynamics is currently constructing a working policy paper that will help drive this effort.
This is a new report brief from the Center for Population Dynamics at Cleveland State University, download the pdf version here. The report was authored by Richey Piiparinen, Jim Russell, and Charlie Post.
2 Hilpert, Ulrich. Archipelago Europe: islands of innovation: synthesis report. FAST, Commission of the European Communities, 1992.
3 Porter, Michael E. "Location, competition, and economic development: Local clusters in a global economy." Economic development quarterly 14.1 (2000): 15-34.
4 Moretti, Enrico. The new geography of jobs. Houghton Mifflin Harcourt, 2012.
7 Source: American Community Survey 1-Year Estimates, 2013
8 See: http://engagedscholarship.csuohio.edu/urban_facpub/1177/
- Login to post comments
 Email this Story


Useless Data Comparison; Badly Written
This 'percentage of total population' metric is nearly useless unless you know how fast the general population increased or decreased. To understand this criticism, imagine that the absolute number of advanced degree holders did not change from 2005 to 2013. In a city with declining general population the percentage of advanced degree holders would appear to increase. In a city with the general population growing rapidly, like Houston or Dallas or Austin, the percentage would appear to decrease. Neither the increase nor the decrease tells us anything important about holders of advanced degrees.
Lacking the underlying change in general population this article is weak, verging on pointless. The authors acknowledge as much in the final two paragraphs, reducing the metric from a theory-supporting insight to a mere "leading indicator". But it's not even that.
As an aside: these writers badly need an editor with a large supply of sharp red pencils. The prose is turgid and organization of thought, especially in the first few paragraphs, is horrible. Also, IBM is not an "industry", and don't start every other paragraph with "But".
Cato
how much is a result of outward blue collar migration?
I'm skeptical here. Take Rhode Island, a state that has actually lost population. Often it is the blue collar and lower middle class (who may be young and just starting out) who are migrating away from the NE and rust belt regions. The older established professionals (often college educated) who are comfortable in their lives may well have no good reason to move. Eventually, you'd have an older, stagnant population population many of whom are well educated. Does this not describe RI?
Now, if you can say that RI or Indianapolis or Cleveland are attracting young college graduates that is one thing. If it's a bunch of old NIMBY minded elitists supporting every policy they can that drives industry out of their states, then it's quite another.