
Finally, there is credible housing affordability data from China. For years, analysts have produced "back of the envelope" anecdotal calculations that have been often as inconsistent as they have been wrong. The Economist has compiled an index of housing affordability in 40 cities, which uses an "average multiple" (average house price divided by average household income) (China Index of Housing Affordability). This is in contrast to the "median multiple," which is the median house price divided by the median household income (used in the Demographia International Housing Affordability Survey and other affordability indexes). The Demographia Survey rates affordability in 9 geographies, including Hong Kong (a special administrative region of China). The average multiple for a metropolitan market is generally similar to the median multiple.
The Economist Data and Methodology
The Economist develops its ratio from central government data on house sales and incomes in individual cities. Like the Demographia Survey, The Economist provides estimates for housing affordability from the perspective of the average urban household, as opposed to the "ex-pat" or "luxury" markets that are typically reported by real estate commentators. The Economist also estimates its price to income ratio using an average house size of 100 square meters (approximately 1,075 square feet). This is larger than the average new house size in the United Kingdom, but smaller than those in the United States, Australia, Canada and New Zealand.
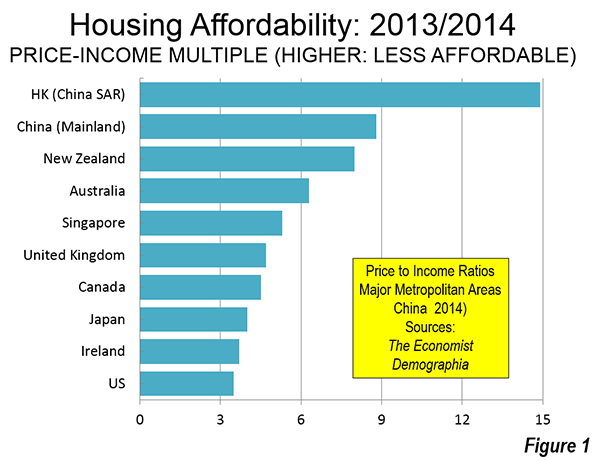
With an overall average multiple of 8.8, China's housing is less affordable (Figure 1) than all of the nine geographies rated in the Demographia Survey, except for Hong Kong (14.9). Even so, China’s housing affordability has improved from a national average multiple of 11.7 in April of 2010.
Affordability by City
It appears that if The Economist had included Hong Kong in its China ranking, it would have been ranked the most unaffordable in the country. Hong Kong houses are much smaller than the Chinese average, at 45 square meters (480 square feet). This would have given Hong Kong, with an unadjusted multiple of 14.9, a house size adjusted multiple of more than 30.
For years, there have been press reports of astronomic price to income multiples in China. The Economist data indicates that in some cities (Shenzhen, Beijing, Hanghzou and Wenzhou) this has indeed been true. But incomes have risen faster than house prices in recent years, and average multiples above 20 are, for now, a thing of the past.
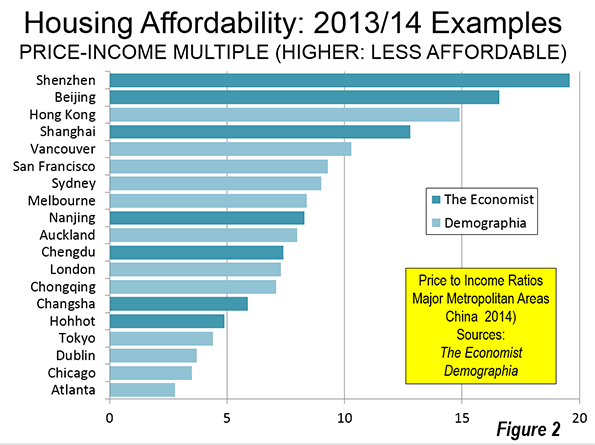
Shenzhen, the "instant" megacity next to Hong Kong, is ranked as the least affordable with an average multiple of 19.6. The Economist indicates that this may be the result of demand from Hong Kong residents. Shenzhen had reached an average multiple of nearly 25 in 2010. An even higher average multiple was recorded in Beijing, which reached 27 in 2010. Beijing house prices have fallen substantially, however, dropping to 16.6 in 2014, the second most unaffordable in China.
China's other megacities (over 10 million population) have lower average multiples than Shenzhen and Beijing. Shanghai has an average multiple of 12.8 and Guangzhou has an average multiple of 11.4. Tianjin, approximately 100 miles (140 kilometers) from Beijing and China's newest megacity has an average multiple of 11.2.
China's most affordable city is Hohhot, capital of Inner Mongolia (Nei Mongol), with an average multiple of 4.9. Generally, interior cities had better housing affordability than those along the east coast. For example, Changsha (capital of Hunan) has an average multiple of 5.9, Kunming 6.6, while the two leading cities of China's Red Basin, Chongqing and Chengdu, were somewhat higher (7.1 and 7.4).
Comparison to Other Demographia Cities
Yet the multiples for many Chinese cities are no worse than highly unaffordable cities in Australia, New Zealand, Canada, the United States, and the United Kingdom.
Outside Hong Kong, the other most expensive cities in the Demographia Survey would rank in the second 10 of Chinese cities. Vancouver, with a median multiple of 10.3, is more expensive than all but 12 of the 40 cities rated in China. San Francisco, with a median multiple of 9.3, would rank 15th. Sydney, with a median multiple of 9.0, would rank in a 16th tie with Dalian. San Jose, at 8.7, would rank in a 19th place tie for unaffordability with Wuhan and Ningbo.
A sampling of cities from China and the Demographia Survey is illustrated in Figure 2.
Toward an Affordable China
One of rapidly urbanizing China's biggest challenges is to improve housing affordability. This is an imperative, with easing of the hukou internal resident permit system and the one-child policy. United Nations projections indicate that China's urban areas will add another third to their population in the next 25 years, an increase of more than 250 million. China is better housed today than perhaps at any time in its history. But it needs to be still better housed, as internal migrants become permanent urban residents and as rural citizens move to the cities for better lives.
Wendell Cox is principal of Demographia, an international public policy and demographics firm. He is co-author of the "Demographia International Housing Affordability Survey" and author of "Demographia World Urban Areas" and "War on the Dream: How Anti-Sprawl Policy Threatens the Quality of Life." He was appointed to three terms on the Los Angeles County Transportation Commission, where he served with the leading city and county leadership as the only non-elected member. He was appointed to the Amtrak Reform Council to fill the unexpired term of Governor Christine Todd Whitman and has served as a visiting professor at the Conservatoire National des Arts et Metiers, a national university in Paris.
Photo: Jinan


