
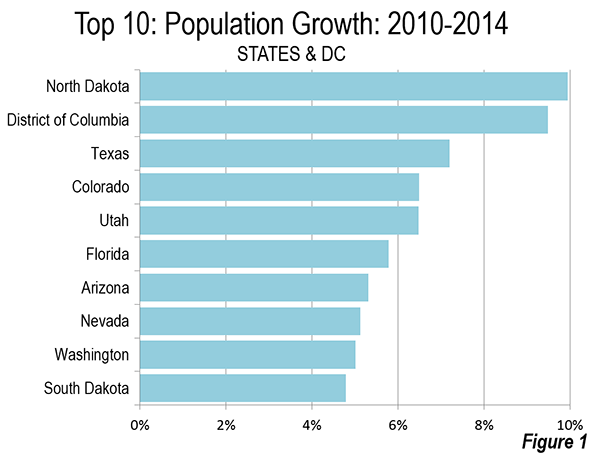
The new Census Bureau state and District of Columbia population estimates indicate that North Dakota grew at the fastest rate from the 2010 census, displacing the District of Columbia, which had grown the fastest from 2010 to 2013. Seven of the 10 fastest growing areas were in the South and West between 2010 and 2014. Only one state, West Virginia, suffered a population loss between 2010 and 2014 (-0.1 percent).
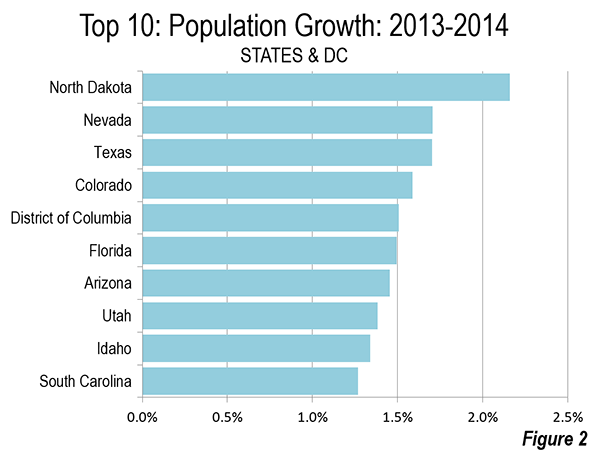
Over the year ended July 1, 2014, North Dakota, Nevada, Texas, Colorado, and the District of Columbia had the fastest growth rates (Figure 2), with eight of the fastest growing areas in the South and West (Figure 2). Five states lost population between 2013 and 2014, with the greatest loss in West Virginia (-0.2 percent). Illinois, Alaska, Connecticut and New Mexico also had losses (Table).
Overall, the US population reached 318.9 million in 2014, an increase of 10.1 million since the 2010 census. The annual growth rate in this decade of 0.81 percent is below the 0.90 percent rate from between 2000 and 2010.
| State & DC Population:2010, 2013 & 2014 | |||||
| 2010 Census | 2013: July 1 | 2014: July 1 | % 2000-14 | Change | |
| Alabama | 4,779,736 | 4,833,996 | 4,849,377 | 1.5% | 69,641 |
| Alaska | 710,231 | 737,259 | 736,732 | 3.7% | 26,501 |
| Arizona | 6,392,017 | 6,634,997 | 6,731,484 | 5.3% | 339,467 |
| Arkansas | 2,915,918 | 2,958,765 | 2,966,369 | 1.7% | 50,451 |
| California | 37,253,956 | 38,431,393 | 38,802,500 | 4.2% | 1,548,544 |
| Colorado | 5,029,196 | 5,272,086 | 5,355,866 | 6.5% | 326,670 |
| Connecticut | 3,574,097 | 3,599,341 | 3,596,677 | 0.6% | 22,580 |
| Delaware | 897,934 | 925,240 | 935,614 | 4.2% | 37,680 |
| District of Columbia | 601,723 | 649,111 | 658,893 | 9.5% | 57,170 |
| Florida | 18,801,310 | 19,600,311 | 19,893,297 | 5.8% | 1,091,987 |
| Georgia | 9,687,653 | 9,994,759 | 10,097,343 | 4.2% | 409,690 |
| Hawaii | 1,360,301 | 1,408,987 | 1,419,561 | 4.4% | 59,260 |
| Idaho | 1,567,582 | 1,612,843 | 1,634,464 | 4.3% | 66,882 |
| Illinois | 12,830,632 | 12,890,552 | 12,880,580 | 0.4% | 49,948 |
| Indiana | 6,483,802 | 6,570,713 | 6,596,855 | 1.7% | 113,053 |
| Iowa | 3,046,355 | 3,092,341 | 3,107,126 | 2.0% | 60,771 |
| Kansas | 2,853,118 | 2,895,801 | 2,904,021 | 1.8% | 50,903 |
| Kentucky | 4,339,367 | 4,399,583 | 4,413,457 | 1.7% | 74,090 |
| Louisiana | 4,533,372 | 4,629,284 | 4,649,676 | 2.6% | 116,304 |
| Maine | 1,328,361 | 1,328,702 | 1,330,089 | 0.1% | 1,728 |
| Maryland | 5,773,552 | 5,938,737 | 5,976,407 | 3.5% | 202,855 |
| Massachusetts | 6,547,629 | 6,708,874 | 6,745,408 | 3.0% | 197,779 |
| Michigan | 9,883,640 | 9,898,193 | 9,909,877 | 0.3% | 26,237 |
| Minnesota | 5,303,925 | 5,422,060 | 5,457,173 | 2.9% | 153,248 |
| Mississippi | 2,967,297 | 2,992,206 | 2,994,079 | 0.9% | 26,782 |
| Missouri | 5,988,927 | 6,044,917 | 6,063,589 | 1.2% | 74,662 |
| Montana | 989,415 | 1,014,864 | 1,023,579 | 3.5% | 34,164 |
| Nebraska | 1,826,341 | 1,868,969 | 1,881,503 | 3.0% | 55,162 |
| Nevada | 2,700,551 | 2,791,494 | 2,839,099 | 5.1% | 138,548 |
| New Hampshire | 1,316,470 | 1,322,616 | 1,326,813 | 0.8% | 10,343 |
| New Jersey | 8,791,894 | 8,911,502 | 8,938,175 | 1.7% | 146,281 |
| New Mexico | 2,059,179 | 2,086,895 | 2,085,572 | 1.3% | 26,393 |
| New York | 19,378,102 | 19,695,680 | 19,746,227 | 1.9% | 368,125 |
| North Carolina | 9,535,483 | 9,848,917 | 9,943,964 | 4.3% | 408,481 |
| North Dakota | 672,591 | 723,857 | 739,482 | 9.9% | 66,891 |
| Ohio | 11,536,504 | 11,572,005 | 11,594,163 | 0.5% | 57,659 |
| Oklahoma | 3,751,351 | 3,853,118 | 3,878,051 | 3.4% | 126,700 |
| Oregon | 3,831,074 | 3,928,068 | 3,970,239 | 3.6% | 139,165 |
| Pennsylvania | 12,702,379 | 12,781,296 | 12,787,209 | 0.7% | 84,830 |
| Rhode Island | 1,052,567 | 1,053,354 | 1,055,173 | 0.2% | 2,606 |
| South Carolina | 4,625,364 | 4,771,929 | 4,832,482 | 4.5% | 207,118 |
| South Dakota | 814,180 | 845,510 | 853,175 | 4.8% | 38,995 |
| Tennessee | 6,346,105 | 6,497,269 | 6,549,352 | 3.2% | 203,247 |
| Texas | 25,145,561 | 26,505,637 | 26,956,958 | 7.2% | 1,811,397 |
| Utah | 2,763,885 | 2,902,787 | 2,942,902 | 6.5% | 179,017 |
| Vermont | 625,741 | 626,855 | 626,562 | 0.1% | 821 |
| Virginia | 8,001,024 | 8,270,345 | 8,326,289 | 4.1% | 325,265 |
| Washington | 6,724,540 | 6,973,742 | 7,061,530 | 5.0% | 336,990 |
| West Virginia | 1,852,994 | 1,853,595 | 1,850,326 | -0.1% | -2,668 |
| Wisconsin | 5,686,986 | 5,742,953 | 5,757,564 | 1.2% | 70,578 |
| Wyoming | 563,626 | 583,223 | 584,153 | 3.6% | 20,527 |
| United States | 308,745,538 | 316,497,531 | 318,857,056 | 3.3% | 10,111,518 |
| Data from Census Bureau | |||||
Domestic Migration by State
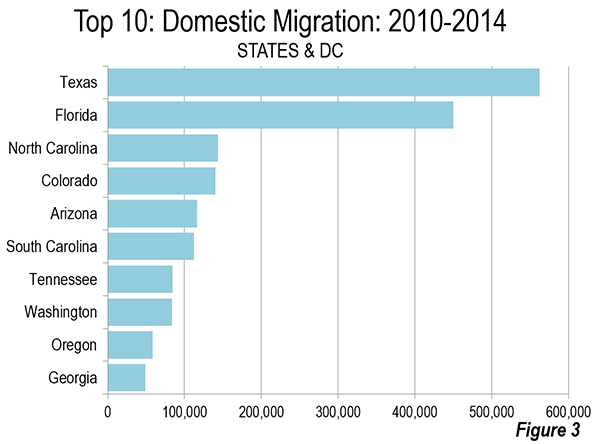
Texas and Florida dominated net domestic migration between 2010 and 2014. Texas added a net 563,000 interstate migrants and Florida added 450,000. Third place North Carolina (143,000) attracted less than one-third of Florida's total. Colorado added 140,000 interstate migrants and Arizona 116,000. One other state added more than 100,000 interstate migrants, South Carolina, at 112,000 (Figure 3). All of the top 10 interstate migration states were either in the South (six) and the West (four).
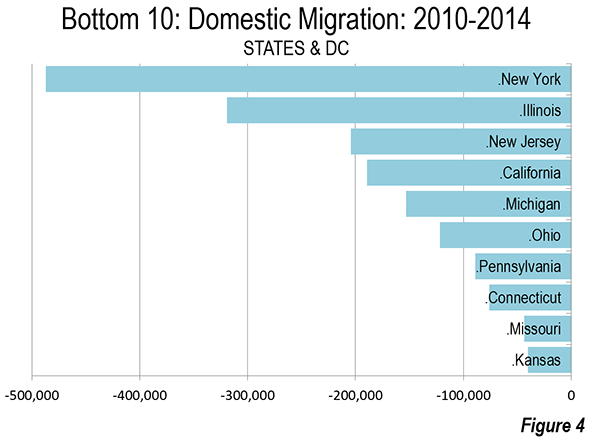
The largest interstate migration losses were in New York (-487,000), Illinois (-319,000), New Jersey (-204,000), California (-189,000) and Michigan (-153,000). The balance of the bottom ten included Ohio, Pennsylvania, Connecticut, Missouri, and Kansas (Figure 4). All of the largest interstate migration losers were in the East (four) or Midwest (five), except for California (which trailed only New York in this category between 2000 and 2010).
Migration by Region
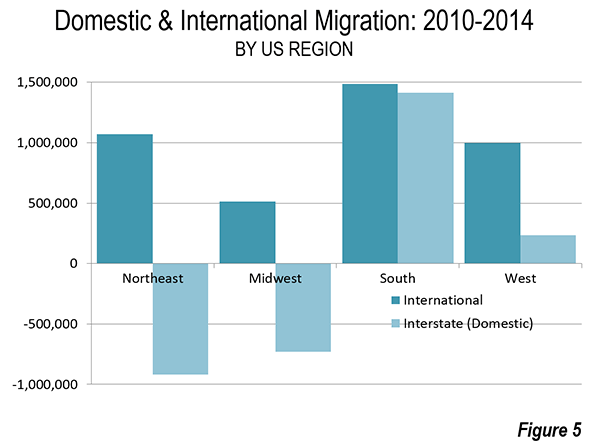
Much of the net domestic migration was to the South, with a net gain of more than 1.4 million from 2010 to 2014. There was a gain of more than 200,000 domestic migrants in the West. All of these domestic migrants were taken from the East and the Midwest, which loss more than 900,000 and 700,000 respectively.
Perhaps more surprising, the largest international migration gains were also in the South, which gained nearly 1,500,000. More than 54 percent of these gains occurred in Florida or Texas. International migration to the East was nearly 1,100,000 and to the West nearly 1,000,000. The lowest international migration was to the Midwest, at over 500,000 (Figure 5). The largest international migration gains were in California, New York, Florida and Texas, all with gains over 300,000.
North Dakota's Fast Growth
Fastest growing North Dakota added 9.9 percent to its population between 2010 and 2014. North Dakota also grew the fastest between 2013 and 2014, with an increase of 2.2 percent. This rate of increase, however, may be challenging to sustain because of North Dakota's reliance on the oil industry for its strong job creation. Sustained low oil prices could reduce growth in the years to come.
Slower Growth in the District of Columbia
The District of Columbia (the city of Washington), which had the fastest growth rate compared to any state between 2010 and 2013, fell to an annual growth rate of 1.5 percent, dropping to 5th position in growth over the last year. Even with the strong population increases early in this decade, Washington remains 240,000 below its population peak (estimated at 900,000 in the middle 1940s by the Census Bureau).
Elsewhere, the early part of the decade has seen important changes in state rankings and population growth rates.
Recovery in Nevada
Nevada regained its position as one of the nation's fastest growing states. Between 1950 and 2010, Nevada experienced by far greatest growth, expanding its population by nearly 16 times. No other state grew remotely as quickly as Nevada. Arizona, which was second fastest growing, had a rate less than half that of Nevada. In 1950, Nevada had only 160,000 residents, fewer people than live in smaller metropolitan areas such as Joplin, Missouri; El Centro, California; and Warner Robbins, Georgia. By 2014, Nevada had grown to 2,839,000 residents.
Nevada also had the fastest growth between 2000 and 2010. However, its growth slowed substantially from the effects of the housing bust induced Great Recession. By the end of the decade was at a near standstill. Between 2009 and 2011, Nevada's growth fell to a ranking of 32nd.
Over the past year, despite claims that the sunbelt boom was over, Nevada has regained its strong growth track, ranking second in growth North Dakota, at 1.7 percent (in a near tie with third ranked Texas). Nevada could recover its leadership in the years to come.
The past year also witnessed an increase in Arizona's population growth, perhaps indicating the end of more restrained growth that resulted from the Great Recession.
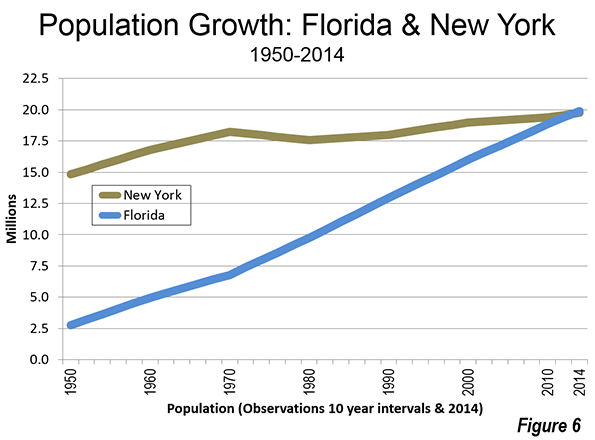
Florida Passes New York
Florida passed New York to become the nation's third largest state in 2014 on July 1. Florida added 293,000 residents in 2014, compared to New York's 51,000.
Florida reflects the massive population shifts that have occurred in the United States since World War II. Since that time, the South and West have grown far faster than the East and East, which had dominated population statistics. In more recent decades, the South has grown considerably faster that the West, as California's breakneck growth has slowed considerably.
In the first post-war census, 1950, Florida had a population of 2.8 million. The nation's largest state at that time was New York, with a population of 14.8 million, more than five times that of Florida. In 1950, Florida had a population only 33,000 more than Brooklyn, the largest of the New York City boroughs. Since that time Florida has added a population more than double that of New York City. While Florida was increasing its population by more than six times, New York's population increase in the last 64 years was less than one-third of the national rate (Figure 6).
New York assumed the top population position in the 1810 census and had maintained its preeminence for more than 150 years. In 1962, New York lost the top position to California in 1963, when both states had approximately 17.5 million residents. New York retained second position for another three decades, until 1994, when Texas assumed the second position; both states had approximately 18.5 million residents. New York's next drop in rank happened two decades later. There seems to be little prospect of New York dropping another notch in near future. A theoretical exercise applying the 2010-2014 annual growth rates to the future indicates that New York would still hold a 7 million advantage over the next largest state in 2050 (North Carolina). Pennsylvania, Illinois, and Ohio, currently the closest in population to New York, have grown even more slowly than the Empire state since 2010.
Former Megastate Michigan Tumbles
Michigan, the only state to reach 10 million residents and then fall back below (2002 through 2007) managed to grow 0.3 percent since 2010. This was insufficient to restore its 10 million status (with megacities defined as 10 million or more population, it seems reasonable to suggest a megastate requires the same population). In 2010, Michigan was the 8th largest state. Georgia passed Michigan in 2012. North Carolina jumped ahead of Michigan in 2012. The growth differences are not as great as in the New York and Florida comparisons. However, Michigan had a much larger 1950 population (6.4 million) in 1950 than North Carolina (4.1 million) and Georgia (3.9 million).
Southern and Western Rise Continues
The first four years of the decade show the partial restoration of patterns of growth similar to the 2000s. In both periods, the South has captured 52 percent of national growth and the West, 32 percent. Some states hard hit by the Great Recession seem to be reasserting their growth (Nevada and Arizona), while Southern states are slowly but surely displacing the states in the East and Midwest that formerly dominated the top 10 population rankings.
Wendell Cox is principal of Demographia, an international public policy and demographics firm. He is co-author of the "Demographia International Housing Affordability Survey" and author of "Demographia World Urban Areas" and "War on the Dream: How Anti-Sprawl Policy Threatens the Quality of Life." He was appointed to three terms on the Los Angeles County Transportation Commission, where he served with the leading city and county leadership as the only non-elected member. He was appointed to the Amtrak Reform Council to fill the unexpired term of Governor Christine Todd Whitman and has served as a visiting professor at the Conservatoire National des Arts et Metiers, a national university in Paris.
Photo: Florida state capital buildings (Tallahasse) by Jenn Greiving


Yes, I read in another study
Yes, I read in another study that Virginia is going slow in the population from last 2-3 years. May be a good sign for the economy and the global crisis.
People are fleeing farther from New York.
The figures for interstate migration losses in New York (-487,000) and New Jersey (-204,000) are particularly significant. Traditionally, New Jersey was a likely destination for people fleeing New York City, and perhaps the most likely destination (for geographical reasons) for businesses leaving the city.
Erratum
4th column of table is labeled
2000-2014
should be 2010-2014
Dave Barnes
+1.303.744.9024