
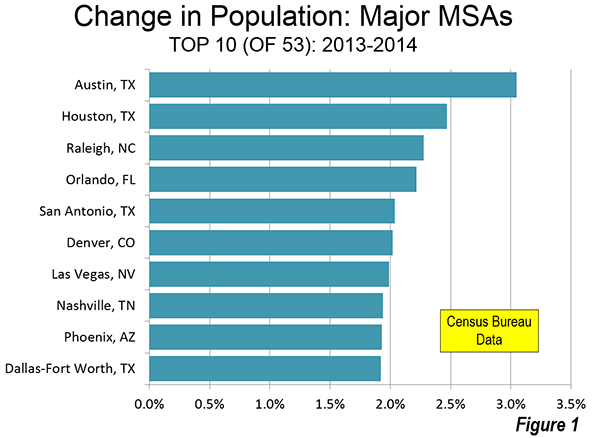
Texas continues to dominate major metropolitan area growth. Among the 53 major metropolitan areas (with more than 1 million population), Texas cities occupied three of five top positions in population growth, and four of the top 10 (Figure 1).
Other parts of the nation are adding population in large numbers as well. The six top 10 cities not in Texas were split evenly between the South and the Mountain West. In the South, Raleigh ranked third, Orlando ranked fourth and Nashville was eighth. Out West, sixth-ranked Denver is maintaining its quick growth rate as the middle of the decade approaches. Two cities that were especially hard hit by the housing bust now seem to be making progress. Las Vegas, has recovered to become the seventh fastest growing city, largely on the strength of substantially improved domestic migration numbers. In 2013-2014, the rate of net domestic migration quadrupled in Las Vegas. Phoenix (9th) is also recovering, and is now established as the nation's 12th largest metropolitan area, having passed Riverside-San Bernardino.
Texas
But the biggest gains were in Texas.
Houston gained the most population between 2013 and 2014, adding 166,000 new residents. This is nearly as much as the gain in the entire Midwest states (177,000) which is home to 10 times as many people. Since 2000, Houston has risen from the nation's eighth largest metropolitan area to its fifth, passing Washington, Miami, and earlier in this decade, Philadelphia.
For the first time in US history, two of the five largest cities in the nation are in Texas. Just ahead of Houston is fourth-ranked Dallas-Fort Worth, which had the second largest population gain at 127,000. This is a larger increase than occurred in the Northeast, which stretches from Pennsylvania, New Jersey, and New York through New England and has more than eight times as many people as Dallas-Fort Worth. While Dallas-Fort Worth's population increase has been slower than Houston's in recent years (10th in 2013-2014), it has risen from a position of ninth in 1992 fourth today (present metropolitan boundaries).
Other Texas cities are also performing well. Austin, as has often been the case since the moderation of growth in Las Vegas during the last decade, has by far the largest population growth rate, at 3.0%, compared to the Houston's 2.5%.
San Antonio, so often overlooked in a state with Houston, Dallas-Fort Worth, and Austin ranked fifth in population growth rate between 2013 and 2014.
Net Domestic Migration
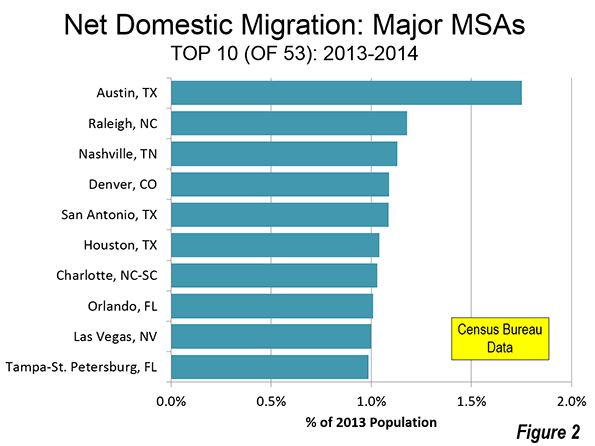
The top cities in net domestic migration almost duplicate the top 10 in population growth. Charlotte and Tampa-St. Petersburg replace Phoenix and Dallas-Fort Worth among the top 10 in net domestic migration (Figure 2).
A number of cities suffered substantial net domestic migration losses (Figure 3). The largest loss was in New York, which lost nearly one percent of its residents to other parts of the country. New York's net domestic migration loss increased more than a third from that of 2011 through 2013, rising to 163,000 in 2014. Almost a net 100,000 left New York City, up from 69,000 in 2012-2013. The suburbs experienced a smaller loss, 64,000, up from 44,000.
The other two largest cities, Los Angeles and Chicago also had larger domestic migration losses (61,000 66,000 respectively) than the other cities. Washington had by far the largest reversal, experiencing a domestic migration loss of 25,000, down from a plus 43,000 between 2012 and 2013.

Additional Developments
There’s also a new member of the million person metropolitan club, Tucson, the 53rd major metropolitan area.
Chicago's growth has virtually stalled. Over the last year, the metropolitan area added only 0.1% to its population. This is less than one quarter the longer-term rate that had previously been projected. At that rate, Chicago would have reached 10 million residents within a decade. At the most recent growth rate, it would take nearly a half century. In light of the expected slower growth rates in the future, Chicago may never reach megacity status, unless its commuting shed expands enough to add new counties along its metropolitan fringe.
However, even without Chicago, the United States could add two new megacities within the next two decades. Both Houston and Dallas-Fort Worth would exceed 10 million by 2040 population if their current growth rates were to be maintained.
Despite being passed by Houston and Dallas-Fort Worth in the last two decades, Washington appears sure to emerge larger than Philadelphia by next year's population estimates. This year, Washington exceeded 6 million population for the first time.
Domestic Migration: Core and Suburban Counties
This is indicated by domestic migration trends, which are reported by the Census Bureau only at the county level. Suburban counties continue to increase their net domestic migration and over the last year attracted nearly 420,000 more new residents from other parts of the nation than the core counties. The suburban counties gained 230,000 net domestic migrants, while the core counties lost 190,000. The low point of suburban net domestic migration occurred in 2012 when the gap relative to core counties was approximately 155,000. In each of the years of this decade, core counties have lost domestic migration, while suburban counties have gained more new residents from elsewhere (Figure 4).

As the nation continues its tepid recovery from the Great Recession, the largest number of people are moving to the suburbs and away from the core counties. This suggests that, normalcy may be gradually returning, with strong growth both in the suburbs and throughout the Sunbelt.
| Major Metropolitan Area Population Estimates | |||||||
| Population | 2013-2014 | ||||||
| Rank | Metropolitan Area | 2010 | 2013 | 2014 | % Change | Net Domestic Migration | Rank: Domestic Migration |
| 1 | New York, NY-NJ-PA | 19,567 | 20,002 | 20,093 | 0.45% | -0.81% | 53 |
| 2 | Los Angeles, CA | 12,829 | 13,176 | 13,262 | 0.66% | -0.47% | 47 |
| 3 | Chicago, IL-IN-WI | 9,461 | 9,545 | 9,555 | 0.10% | -0.69% | 51 |
| 4 | Dallas-Fort Worth, TX | 6,426 | 6,823 | 6,954 | 1.92% | 0.72% | 13 |
| 5 | Houston, TX | 5,920 | 6,334 | 6,490 | 2.47% | 1.04% | 6 |
| 6 | Philadelphia, PA-NJ-DE-MD | 5,965 | 6,036 | 6,051 | 0.25% | -0.34% | 42 |
| 7 | Washington, DC-VA-MD-WV | 5,636 | 5,967 | 6,034 | 1.12% | -0.41% | 45 |
| 8 | Miami, FL | 5,565 | 5,863 | 5,930 | 1.13% | -0.21% | 35 |
| 9 | Atlanta, GA | 5,287 | 5,525 | 5,614 | 1.61% | 0.58% | 15 |
| 10 | Boston, MA-NH | 4,552 | 4,698 | 4,732 | 0.73% | -0.22% | 37 |
| 11 | San Francisco-Oakland, CA | 4,335 | 4,530 | 4,594 | 1.42% | 0.32% | 21 |
| 12 | Phoenix, AZ | 4,193 | 4,404 | 4,489 | 1.93% | 0.93% | 11 |
| 13 | Riverside-San Bernardino, CA | 4,225 | 4,390 | 4,442 | 1.18% | 0.24% | 23 |
| 14 | Detroit, MI | 4,296 | 4,295 | 4,297 | 0.03% | -0.47% | 48 |
| 15 | Seattle, WA | 3,440 | 3,614 | 3,671 | 1.60% | 0.48% | 16 |
| 16 | Minneapolis-St. Paul, MN-WI | 3,349 | 3,461 | 3,495 | 0.97% | -0.02% | 31 |
| 17 | San Diego, CA | 3,095 | 3,223 | 3,263 | 1.27% | 0.08% | 28 |
| 18 | Tampa-St. Petersburg, FL | 2,783 | 2,874 | 2,916 | 1.44% | 0.99% | 10 |
| 19 | St. Louis,, MO-IL | 2,788 | 2,802 | 2,806 | 0.16% | -0.28% | 39 |
| 20 | Baltimore, MD | 2,710 | 2,774 | 2,786 | 0.43% | -0.23% | 38 |
| 21 | Denver, CO | 2,543 | 2,700 | 2,754 | 2.02% | 1.09% | 4 |
| 22 | Charlotte, NC-SC | 2,217 | 2,337 | 2,380 | 1.84% | 1.03% | 7 |
| 23 | Pittsburgh, PA | 2,356 | 2,361 | 2,356 | -0.19% | -0.12% | 33 |
| 24 | Portland, OR-WA | 2,226 | 2,315 | 2,348 | 1.45% | 0.71% | 14 |
| 25 | San Antonio, TX | 2,143 | 2,282 | 2,329 | 2.04% | 1.09% | 5 |
| 26 | Orlando, FL | 2,134 | 2,271 | 2,321 | 2.22% | 1.01% | 8 |
| 27 | Sacramento, CA | 2,149 | 2,218 | 2,244 | 1.21% | 0.37% | 19 |
| 28 | Cincinnati, OH-KY-IN | 2,115 | 2,139 | 2,149 | 0.51% | -0.04% | 32 |
| 29 | Kansas City, MO-KS | 2,009 | 2,055 | 2,071 | 0.77% | 0.05% | 29 |
| 30 | Las Vegas, NV | 1,951 | 2,029 | 2,070 | 1.99% | 1.00% | 9 |
| 31 | Cleveland, OH | 2,077 | 2,065 | 2,064 | -0.08% | -0.38% | 44 |
| 32 | Columbus, OH | 1,902 | 1,969 | 1,995 | 1.30% | 0.44% | 17 |
| 33 | Indianapolis. IN | 1,888 | 1,953 | 1,971 | 0.93% | 0.11% | 26 |
| 34 | San Jose, CA | 1,837 | 1,929 | 1,953 | 1.25% | -0.37% | 43 |
| 35 | Austin, TX | 1,716 | 1,886 | 1,943 | 3.05% | 1.75% | 1 |
| 36 | Nashville, TN | 1,671 | 1,759 | 1,793 | 1.94% | 1.13% | 3 |
| 37 | Virginia Beach-Norfolk, VA-NC | 1,677 | 1,707 | 1,717 | 0.54% | -0.30% | 40 |
| 38 | Providence, RI-MA | 1,601 | 1,606 | 1,609 | 0.24% | -0.16% | 34 |
| 39 | Milwaukee,WI | 1,556 | 1,570 | 1,572 | 0.13% | -0.45% | 46 |
| 40 | Jacksonville, FL | 1,346 | 1,396 | 1,419 | 1.65% | 0.92% | 12 |
| 41 | Memphis, TN-MS-AR | 1,325 | 1,342 | 1,343 | 0.11% | -0.55% | 50 |
| 42 | Oklahoma City, OK | 1,253 | 1,321 | 1,337 | 1.23% | 0.43% | 18 |
| 43 | Louisville, KY-IN | 1,236 | 1,262 | 1,270 | 0.59% | 0.12% | 25 |
| 44 | Richmond, VA | 1,208 | 1,247 | 1,260 | 1.06% | 0.36% | 20 |
| 45 | New Orleans. LA | 1,190 | 1,242 | 1,252 | 0.80% | 0.16% | 24 |
| 46 | Raleigh, NC | 1,130 | 1,215 | 1,243 | 2.28% | 1.18% | 2 |
| 47 | Hartford, CT | 1,212 | 1,216 | 1,214 | -0.14% | -0.71% | 52 |
| 48 | Salt Lake City, UT | 1,088 | 1,142 | 1,153 | 1.03% | -0.32% | 41 |
| 49 | Birmingham, AL | 1,128 | 1,140 | 1,144 | 0.37% | 0.02% | 30 |
| 50 | Buffalo, NY | 1,136 | 1,136 | 1,136 | 0.02% | -0.22% | 36 |
| 51 | Rochester, NY | 1,080 | 1,084 | 1,083 | -0.06% | -0.52% | 49 |
| 52 | Grand Rapids, MI | 989 | 1,017 | 1,028 | 1.03% | 0.25% | 22 |
| 53 | Tucson, AZ | 980 | 998 | 1,005 | 0.65% | 0.09% | 27 |
| In 000s | |||||||
| Data from Census Bureau | |||||||
--------
Note: Core counties are the counties with the largest historical core municipalities as well as the five counties that make up the core city of New York.
Photograph: Houston Suburbs by author
Wendell Cox is principal of Demographia, an international public policy firm located in the St. Louis metropolitan area. He has served as a visiting professor at the Conservatoire National des Arts et Metiers in Paris since 2002. His principal interests are economics, poverty alleviation, demographics, urban policy and transport. He is co-author of the annual Demographia International Housing Affordability Survey and Demographia World Urban Areas.


Nose Jobs
Thanks for posting this great stuff. Bookmark our website with the best nose job.