
Housing affordability and its impact on middle income households around the world is emerging as a major concern throughout the developed world. The largest element in household budgets is housing, and house prices have skyrocketed relative to incomes in many metropolitan areas, especially those that have adopted strict land use regulation (particularly urban containment, as described below).
The 12th Annual Demographia International Housing Affordability Survey reports that, as of the third quarter of 2015, Hong Kong has the least affordable housing among major markets in 9 nations, followed by Sydney, Vancouver, with Auckland, Melbourne, San Jose, San Francisco, London, Los Angeles and San Diego. In each of these markets, housing costs are now triple or more their levels before restrictive land use regulation (house prices have tripled compared to incomes).
Ranking Similarities: Demographia and the UBS Real Estate Bubble Index
The Demographia list of least affordable metropolitan areas is largely echoed by UBS, the international financial services company headquartered in Switzerland. The UBS Global Real Estate Bubble Index ranks London, Hong Kong, Sydney and Vancouver as most vulnerable to risk from a real estate bubble. Demographia rates Hong Kong, Sydney and Vancouver as having the least affordable housing. London is ranked 8th in the Demographia Survey. Overall, the five cities rated by UBS as the most vulnerable are included among the eight least affordable in the Demographia Survey. The three other cities ranked in the least affordable eight by Demographia are not considered in the UBS report.
Background on Middle-Income Housing Affordability
In his introduction to the Survey, Senator Bob Day (Australian federal Senate) recalls that: “For more than 100 years the average Australian family was able to buy its first home on one wage. The median house price was around three times the median income allowing young home buyers easy entry into the housing market.”
Senator Day’s description of the experience in Australia tracks with that of other nations. Following World War II and until the early 1970s, virtually all metropolitan areas in Australia, Canada, Ireland, New Zealand, the United Kingdom and the United States had median multiples around 3.0 or below.
Since then far more restrictive land use policies have spread beyond the metropolitan areas to many others in other nations. This has often included urban containment policies (called “urban consolidation in Australia”), which severely limit or even prohibit new housing construction on or beyond the urban fringe. The result, as basic economics predicts, is higher land prices and skyrocketing housing costs, (despite expectations to the contrary by planners).
Rating Housing Affordability
The Demographia International Housing Affordability Survey uses the "median multiple" price-to-income ratio. The median multiple is calculated by dividing the median house price by the median household income. Housing affordability ratings are indicated in Table 1.
Virtually all of the severely unaffordable major markets in this year’s Survey exercise urban containment policy. Meanwhile, no market without strong land use regulation has ever been rated as severely unaffordable in the 12 years of the Survey.
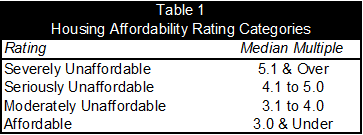
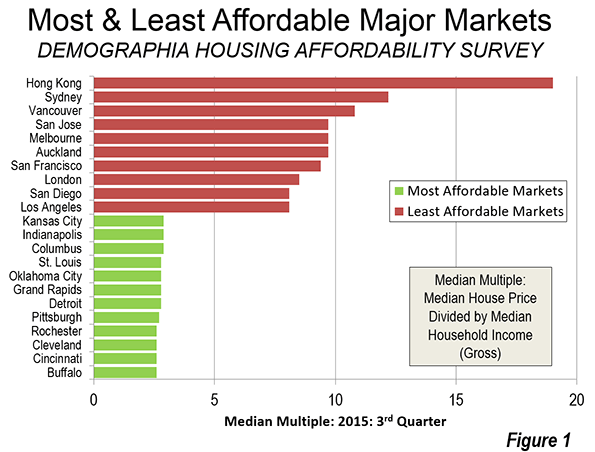
The Bottom 10: Least Affordable Major Metropolitan Markets
The kinds of restrictions on development that Senator Day outlines are evident in the most unaffordable metropolitan areas.
For the fifth straight year, Hong Kong had the least affordable housing. Its median multiple was 19.0. Sydney became the second least affordable, at 12.2, leaping by 3.2 points, the largest annual increase ever recorded among major markets in the Survey. Sydney displaced Vancouver, which had the third least affordable housing among the major markets, with a median multiple of 10.8. This is up from 10.6 last year. Each of these is the highest median multiple recorded in these markets in the history of the Survey.
Three metropolitan markets tied in fourth position with a median multiple of 9.7, San Jose, Melbourne and Auckland. San Francisco was the 7th least affordable market, with a median multiple of 9.4, followed by London (8.5). San Diego and Los Angeles, which both had a median multiple of 8.1 (Figure 1).
Urban containment markets clearly and nearly perennially suffer declines in housing affordability. In 2013, the same ten metropolitan markets were the least affordable and had an average median multiple of 9.1. By 2015, their average median multiple had risen to 10.5. Housing affordability deteriorated in all 10 markets (house prices rose faster than incomes). This loss in housing affordability was at least 14 times the loss in the 10 most affordable markets (below).
The Top 10: Most Affordable Major Metropolitan Markets
Again, the United States, with its multiple regulatory variations accounted for all of the top 10 in housing affordability (actually the top 12, because of a four way tie for ninth position). Buffalo, Cincinnati, Cleveland and Rochester had the most affordable housing, with a median multiple of 2.6. Pittsburgh ranked 5th, at 2.7. Detroit, Grand Rapids and St. Louis tied for 6th, at 2.8. The tenth place tie was between Columbus, Indianapolis, Oklahoma City and Kansas City, with a median multiple of 2.9.
By contrast, the top ten markets experienced relatively little deterioration in housing affordability over the past two years. In 2013, their median multiple averaged 2.6, and rose to 2.7 in 2015 (Figure 1). The housing affordability deterioration in the bottom 10 markets (all urban containment markets) was 14 times as high, as noted above.
Among the five megacities (over 10 million population) in the Survey, Osaka-Kobe-Kyoto had the best housing affordability, with a moderately unaffordable median multiple of 3.4.
All Markets
Overall, the Survey included 368 markets. The most favorable housing affordability was in Ireland, with a median multiple among the markets of 2.8. This was the third year in a row that Ireland had the best housing affordability. In the nine prior years of the Survey, the most affordable housing had always been in either Canada or the United States (Figure 2).
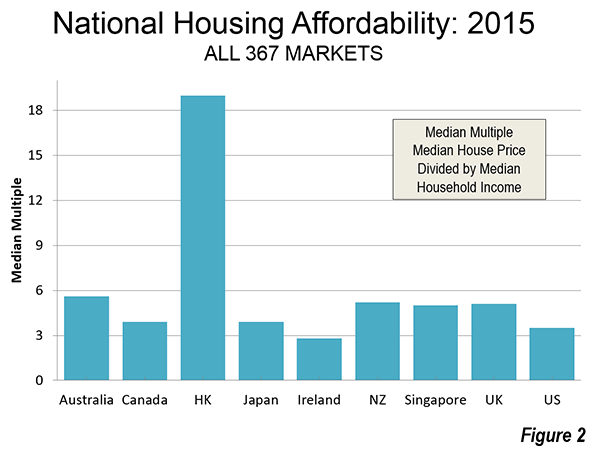
The United States was the second most affordable in 2015, with a median multiple of 3.5. Canada and Japan tied for third, with median multiples of 3.9. Four geographies with virtually universal urban containment policy were the least affordable, the United Kingdom (5.1), New Zealand (5.2), Australia (5.6) and Hong Kong (19.0).
Singapore, though seriously unaffordable at 5.0, is far more affordable than its long-time rival, Hong Kong (19.0). Each has virtually no suburban or rural hinterland and high population density. Yet there is a serious difference in housing policy. In contrast to Hong Kong, Singapore’s e Housing and Development Board, which accounts for approximately 90 percent of housing (which after sale is privately owned) has increased production and reduced new house prices which has led to a lowering of resale house prices as well.
A Wholly Contrived Crisis
Senator Day characterizes the housing affordability crisis “wholly contrived,” and “a matter of political choice… the product of restrictions imposed through planning regulation and zoning.” Senator Day calls the economic consequences of present land use policies “devastating.” He argues that governments and central banks have been too hasty to blame unprecedented housing affordability losses on demand factors, while missing the “real culprit,” which is the “refusal of … governments … to provide an adequate and affordable supply of land for new housing stock to meet demand (typically urban containment policy).
Without reform, prospects for middle income households are grim in the metropolitan areas with urban containment policy. Housing affordability can be expected to deteriorate more, with dire economic and social consequences. According to London School of Economics and Political Science economists Paul C. Cheshire, Max Nathan and Henry G. Overman (see: People Rather than Places, Ends Rather than Means: LSE Economists on Urban Containment).
"The problem is it is utterly unviable in the long term. With every passing decade the problems would get worse, the wider economic costs would become more penalising, the economy and monetary policy more unmanageable and the outcomes – the divide between the property haves and the property have-nots – more unacceptable."
Wendell Cox is Chair, Housing Affordability and Municipal Policy for the Frontier Centre for Public Policy (Canada), is a Senior Fellow of the Center for Opportunity Urbanism (US), a member of the Board of Advisors of the Center for Demographics and Policy at Chapman University (California) and principal of Demographia, an international public policy and demographics firm. He is co-author of the "Demographia International Housing Affordability Survey" and author of "Demographia World Urban Areas" and "War on the Dream: How Anti-Sprawl Policy Threatens the Quality of Life." He was appointed to three terms on the Los Angeles County Transportation Commission, where he served with the leading city and county leadership as the only non-elected member. He served as a visiting professor at the Conservatoire National des Arts et Metiers, a national university in Paris.
Photo: Sign advertising new house and land packages starting in the $170,000s. Suburban St. Louis, third quarter 2015 (photo by author).


