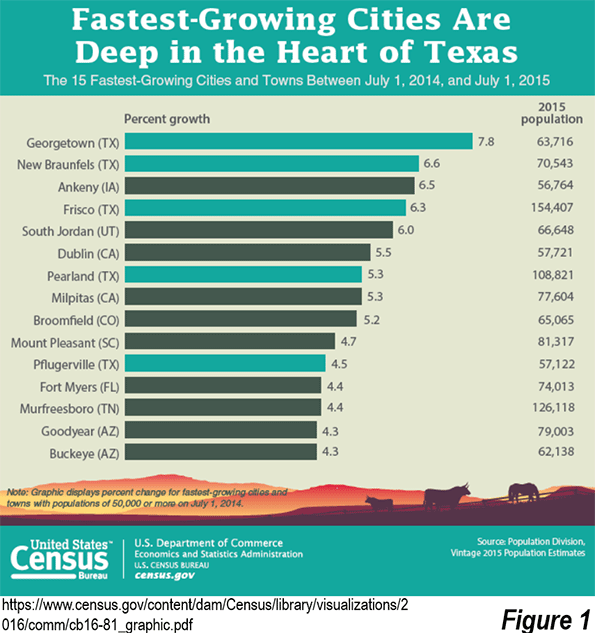
Data released by the federal government last week provided additional evidence that the suburbs continue to dominate metropolitan area population growth and that the biggest cities are capturing less of the growth than they did at the beginning of the decade. The new 2015 municipality population estimates from the Census Bureau indicated that virtually all of the 15 fastest growing municipalities with more than 50,000 residents were suburbs, and five were in Texas (See Census Bureau poster, Figure 1). Further, in the major metropolitan areas (more than 1,000,000 population), nearly 75 percent of the population growth was in outside the historical core municipalities (the suburbs as defined by municipal jurisdiction).
But that’s only half of the story. The suburbs and exurbs also continue to dominate employment and employment growth, according to the annual County Business Patterns data. County Business Patterns is a particularly effective measure of genuine job location preferences (both employers and employees), since it largely provides data for private employment.
Analysis of the data using the City Sector Model indicates that both over the longer and shorter term, the outer reaches of US metropolitan have been more than holding their own in employment growth.
The City Sector Model
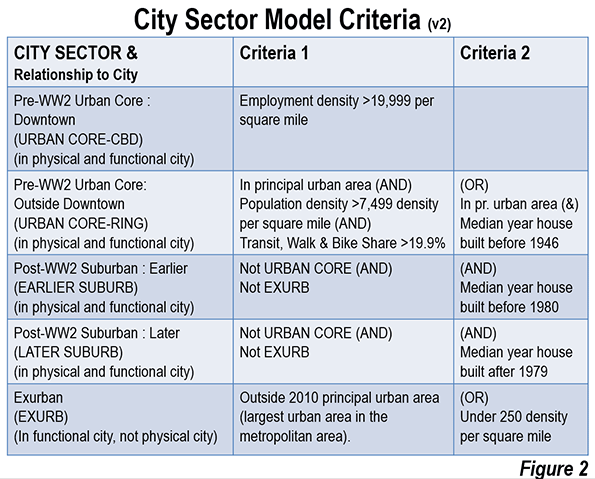
The City Sector Model classifies small areas (zip codes) of major metropolitan areas by their urban function (lifestyle). The City Sector Model includes five sectors (Figure 2). The first two are labelled as “urban core,” replicating the urban densities and travel patterns of pre-World War II US cities, although these likely fall short of densities and travel behavior changes sought by contemporary urban planning (such as Plan Bay Area). There are two suburban sectors, earlier and later. The fifth sector is the exurbs, outside the built-up urban area. The principle purpose of the City Sector Model is to categorize metropolitan neighborhoods based on their intensity of urbanization, regardless of whether they are located within or outside the boundaries of the historical core municipality (Note).
Most Jobs are Outside the Urban Core
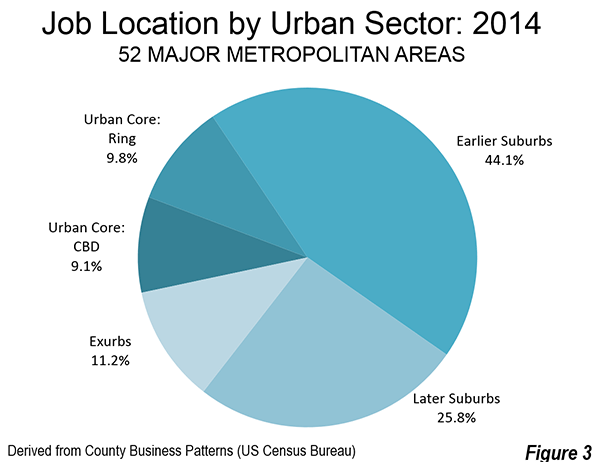
The 2014 data indicates that more than 80 percent of employment in the nation’s major metropolitan areas is in functionally suburban or exurban areas (Figure 3). The earlier suburbs have the largest share of employment, at 44 percent. The later suburbs and exurbs combined have 37.0 percent, while the urban cores have 18.9 percent, including the 9.1 percent in the downtown areas (central business districts, or CBDs).
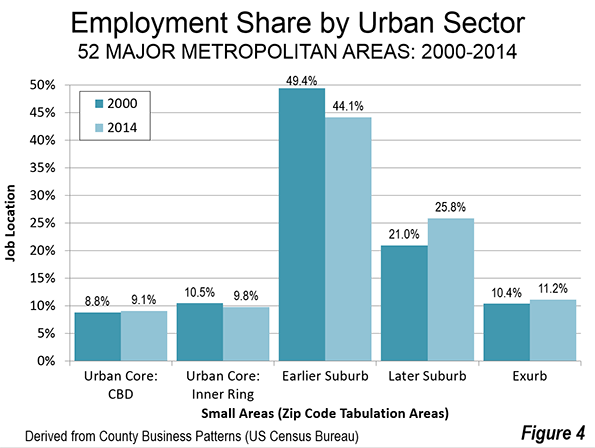
These numbers reveal dispersion since 2000. Then, the earlier suburbs had even more of the jobs, at 49.4 percent, 5.3 percentage points higher than in 2014. Virtually all of the lost share of jobs in the earlier suburbs was transferred to the later suburbs and exurbs, which combined grew from 31.4 percent in 2000 to 37.0 percent in 2014. The urban cores had 19.4 percent of the jobs (8.8 percent in the CBDs), slightly more than the 18.9 percent in 2014 (Figure 4).
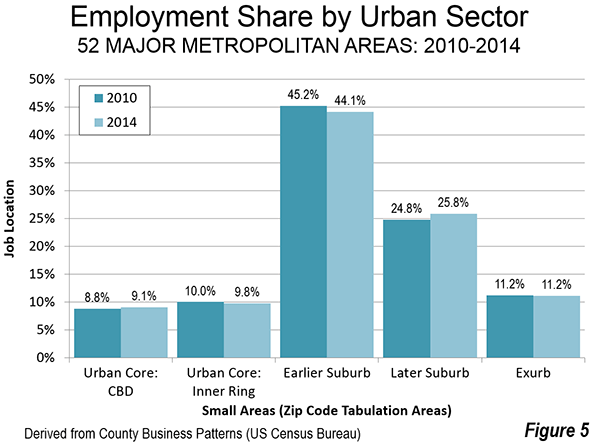
Things have been much more stable since 2010, with a small loss in the earlier suburbs (-1.1 percentage points), a small gain in the urban core (plus 0.1 percentage points), which includes a 0.3 percentage point gain in the CBDs. The later suburbs gained 1.0 percentage points, while the exurbs held the same share as in 2010 (Figure 5).
Most Jobs Growth Since 2010 has been Outside the Urban Core
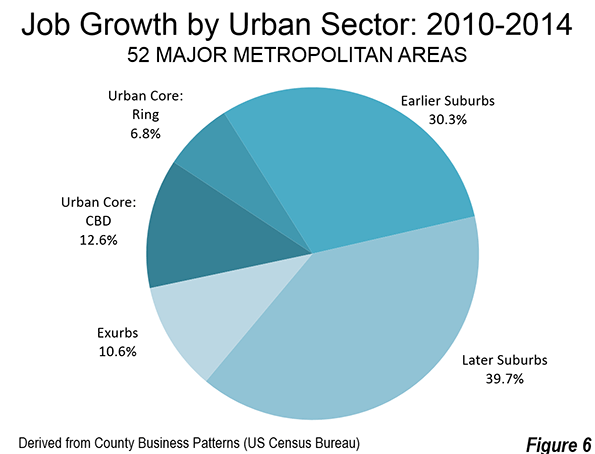
Between 2010 and 2014, more than 80 percent of the employment growth was in the suburbs and exurbs (Figure 6), approximately the same figure as their overall combined share of employment. The later suburbs have added more than their employment share since 2010 (39.7 percent compare to 24.8 percent), while the earlier suburbs and the exurbs have added a smaller percentage compared to their 2010 share of jobs (30.8 percent versus 45.2 percent and 10.6 percent versus 11.2 percent, respectively).
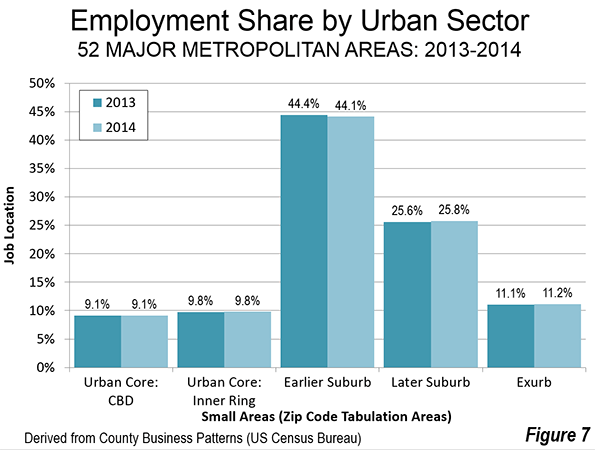
In the last year (2013 to 2014), the data has remained similar, with smaller changes in the same direction as before (Figure 7). The earlier suburbs experienced a small loss (0.3 percentage points), while the later suburbs gained 0.2 percentage points, the exurbs gained 0.1 percentage points and the urban cores remained constant (including no change in the CBDs).
Where the Jobs are By Urban Sector
There is substantial variation in the distribution of jobs within metropolitan areas.
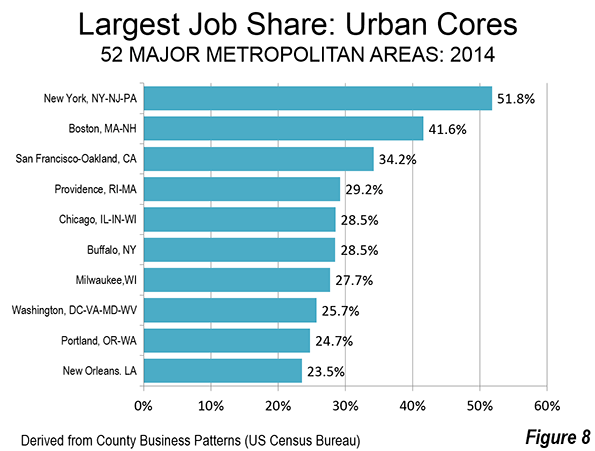
Not surprisingly, the largest urban core job concentrations are in the metropolitan areas with older and larger core municipalities. Nearly 52 percent of the employment in the New York metropolitan area is in the urban core, which includes the nation’s largest central business district. Chicago, Washington, Boston and San Francisco, with the next four largest CBDs (though all small compared to New York) also rank among the 10 metropolitan areas with the greatest employment share in their urban cores (Figure 8). Only 16 of the 52 major metropolitan areas had more than 20 percent of their employment in urban cores (36 had 80 percent or more of their employment in the suburbs or exurbs).
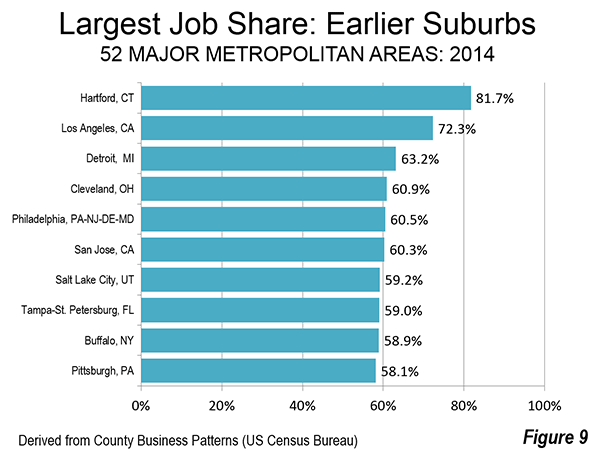
The metropolitan areas with greater job concentration in the earlier suburbs typically experienced more of their growth in the decades immediately following World War II. Hartford has the largest share of employment in the earlier suburbs, at 81.7 percent (Figure 9). Los Angeles, perhaps the original polycentric city, ranks second, at 72.3 percent. This list also includes Rust Belt metropolitan areas that have either grown little or lost population (Detroit, Cleveland, Pittsburgh and Buffalo).
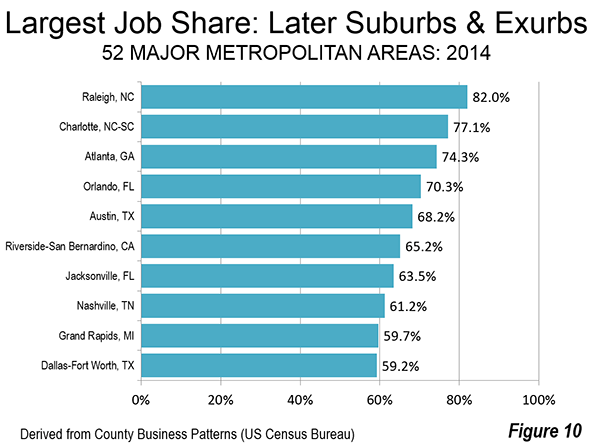
The metropolitan areas that have had the greatest recent population growth dominate in later suburban and exurban employment (Figure 10). More than 82 percent of Raleigh’s employment is in the later suburbs and exurbs. All but one of the 10 metropolitan areas with the largest job share in the later suburbs and exurbs were among the 15 fastest growing in terms of overall population between 1980 and 2010. The one exception is Grand Rapids, which ranked 27th in growth from 1980 to 2010.
Balanced Metropolitan Areas
The meme that people were moving back to the city (urban core) has been with us for decades. For just as long, there have been virtually no reality to the narrative. . The overwhelming share of the population lives and works the suburbs and exurbs. This is where both population growth continues and job growth is concentrated. One fortunate result is metropolitan areas with remarkable balances between home and employment locations, and among the shortest work trip travel times in the world.
------
Note: In some cases the functional urban core extends beyond the boundaries of the historical core municipality (such as in New York and Boston). In other cases, there is virtually no functional urban core (such as in San Jose or Phoenix). Functional urban cores accounted for 14.7 percent of the major metropolitan area population in 2012. By comparison, the jurisdictional urban cores (historical core municipalities) had 26.6 percent of the major metropolitan population, many consisting of large tracts of functional suburban development.
Wendell Cox is principal of Demographia, an international pubilc policy and demographics firm. He is a Senior Fellow of the Center for Opportunity Urbanism (US), Senior Fellow for Housing Affordability and Municipal Policy for the Frontier Centre for Public Policy (Canada), and a member of the Board of Advisors of the Center for Demographics and Policy at Chapman University (California). He is co-author of the "Demographia International Housing Affordability Survey" and author of "Demographia World Urban Areas" and "War on the Dream: How Anti-Sprawl Policy Threatens the Quality of Life." He was appointed to three terms on the Los Angeles County Transportation Commission, where he served with the leading city and county leadership as the only non-elected member. He served as a visiting professor at the Conservatoire National des Arts et Metiers, a national university in Paris.
Photograph: Suburban fringe, St. Louis (by author)


