
The Internal Revenue Service (IRS) has released its 2013 to 2014 migration data. This data provides estimates of residential movement between counties and states based on the number of claimed exemptions on IRS income tax forms. According to IRS, this "approximates the number of individuals" who moved between jurisdictions. Of course, not all people are covered by filed income tax returns, yet this covers approximately 80 percent of the population, and unlike Census Bureau annual data, this is counts of actual people (and incomes). As such, the IRS data is probably the best approximation of domestic migration available. This article outlines data relating to state to state (and District of Columbia) domestic migration.
Net Domestic Migration: Gainers
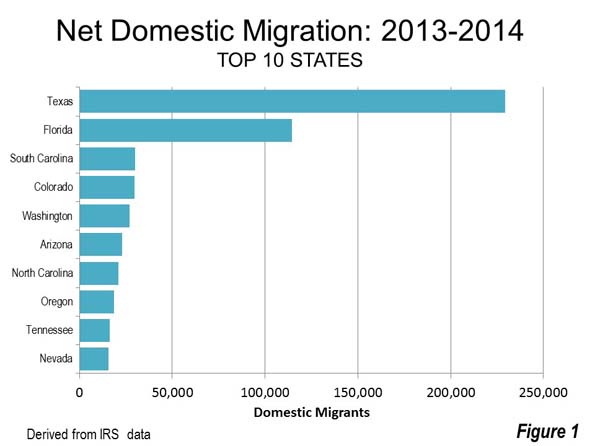
Net domestic migration, calculated by subtracting the number of people moving out of state from the number of people moving into a state, was by far the greatest in Texas and Florida. This is not surprising, since these states have routinely been at the top of the domestic migration league tables for virtually all of the new century. The once exception was for a brief period during the housing bubble when the Florida numbers were depressed. During that period, Florida's reached levels only exceeded by California but have since been moderated. That, plus a severe local recession, were associated with the drop in net domestic migration.
This year's champion was Texas. The Lone Star State had net domestic migration of 229,300. This is more than double the net domestic migration of second ranking Florida and exceeds the total net domestic migration of the other 16 states that gained. The District of Columbia and 30 states experienced net domestic losses between 2013 and 2014.
Florida added 114,400 net domestic migrants, which is nearly 4 times as large as third ranking South Carolina (30,100). Colorado followed closely, at 29,500 net domestic migrants, with Washington placing fifth (Figure 1)
Net Domestic Migration: Losers
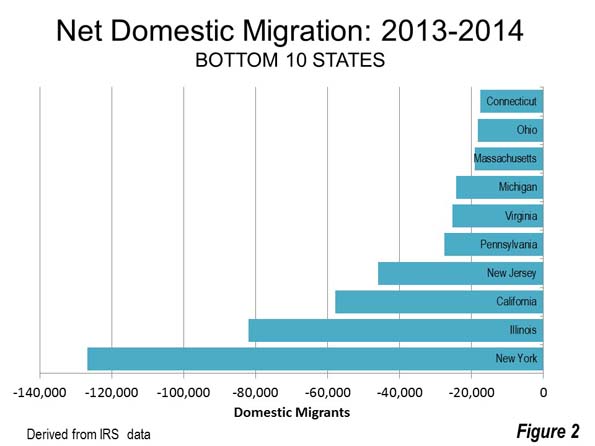
The states with the largest net domestic migration losses are no surprise. New York, which has led net domestic out-migration in most recent years, did so again, with the loss of 126,800. Illinois lost the second greatest number of domestic migrants at 82,000. California ranked third, with a loss of 57,900. New Jersey had the fourth largest loss at 46,000, followed by Pennsylvania at 27,500 (Figure 2).
State Attraction Ratio
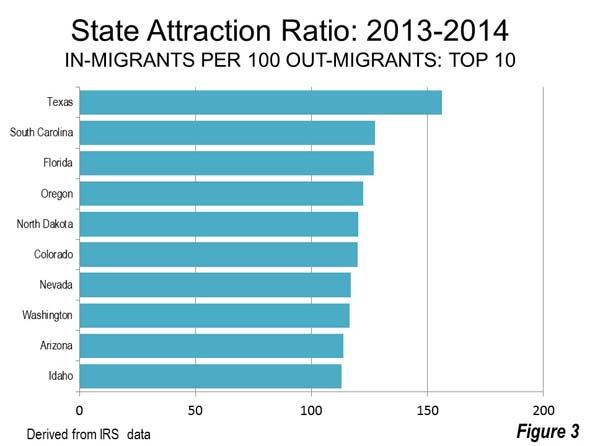
A state attraction ratio was developed, by dividing out-migration by in-migration (stated in out-migrants per 100 in-migrants). Not surprisingly, the highest state attraction ratio was in Texas, at 156.3, South Carolina ranked second, with 127.3 in-migrants per 100 out-migrants, with Florida close behind at 126.7. The fourth and fifth highest state attraction rates were in Oregon, at 122.3 and North Dakota at 120.2 (Figure 3).
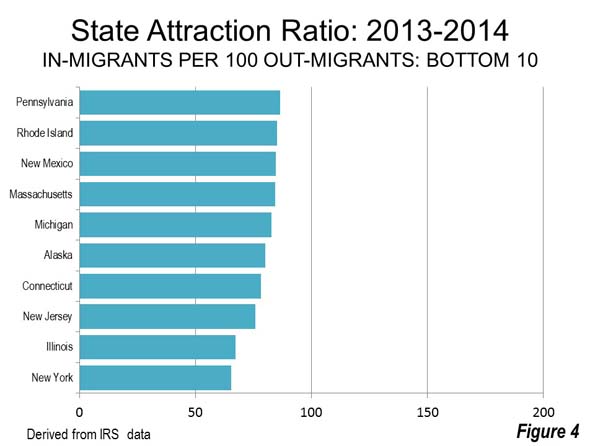
The lowest state attractions ratio --- those places were leavers most outpaced in-migrants --- was in New York, where 65.4 people moved into the state for every 100 who moved out. Illinois was close behind at 67.1. In New Jersey, the ratio was 75.9, in Connecticut 78.3 and Alaska had the fifth lowest state attraction ratio at 80.1 (Figure 4)
Income per Capita: In-migrants
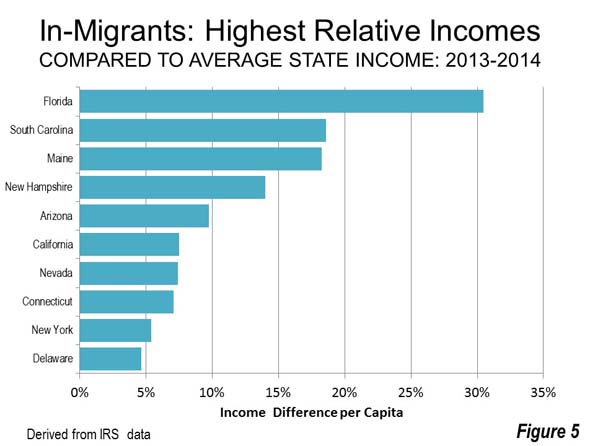
In 17 states, the per capita income of people moving from other states exceeded that of their new state's overall average income. The biggest differences was in Florida, where in-migrant incomes were 30.5 percent higher than average. Migrants to South Carolina averaged 18.6 percent more than the state average income, while migrants to Maine had 18.3 percent higher incomes. The top five was rounded out by New Hampshire, where in-migrants had average incomes 14.0 percent greater than average and Arizona where the differential was 9.8 percent (Figure 5)
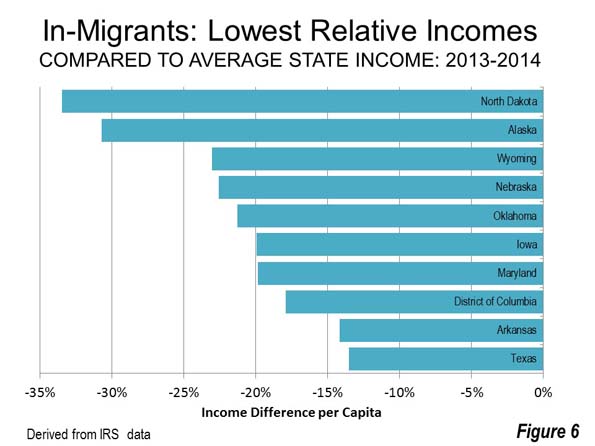
The lowest in-migrant incomes relative to state averages were in states with large resource industries. The biggest difference was in North Dakota, where the average new resident had an income 33.5 percent below average. In Alaska, the difference was 30.7 percent, while in Wyoming it was 23.0 percent. Newcomers to Nebraska averaged 22.6 percent below the state average, while the fifth lowest figure was registered in Oklahoma at -21.3 percent (Figure 6)
Income per Capita: Out-migrants
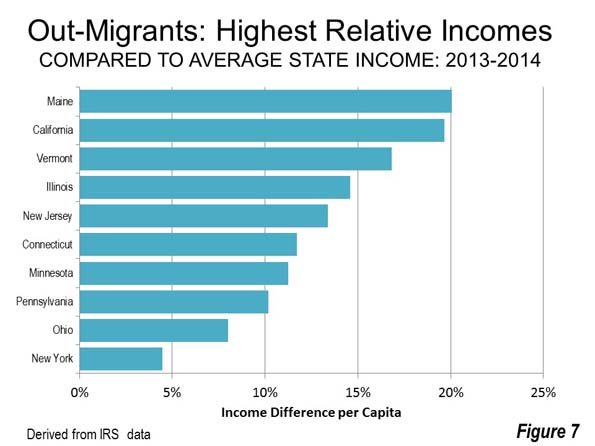
In 17 states, people heading for other states had higher incomes per capita than the average in their former states. The biggest differential was in Maine, where out-migrants had average incomes 20.1 percent higher than the overall state average. The second largest differential was in California where out-migrants had 19.7 percent higher incomes than California residents who remained, followed by Connecticut at 16.8 percent. The average income of people leaving was 14.6 percent greater than the Illinois average. In New Jersey, the average income of levers was 13.4 percent greater than the state average (Figure 7).
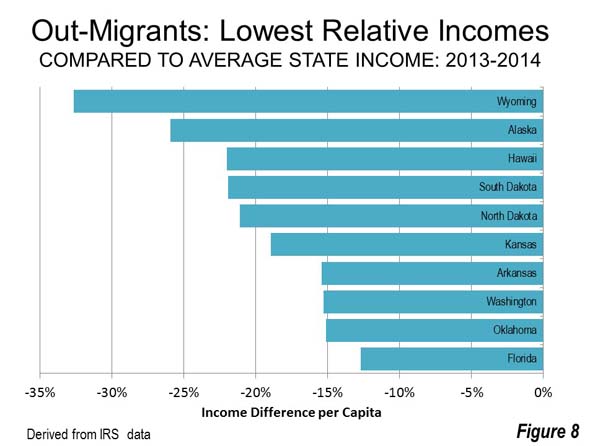
Wyoming residents had the largest income differential relative to newcomers, at 32.6 percent. In Alaska, new migrants had average incomes 25.9 percent below the state average and in Hawaii, new migrants had average incomes 22.0 percent below the state average. The fourth and fifth lowest newcomer incomes were in South Dakota, 21.9 percent below the state average and North Dakota, 21.1 percent below the state average (Figure 8)
New Results Track Old
There is a striking similarity between the domestic migration results for 2013-4 and those reported by the Census Bureau population estimates program from 2000 to 2013 (no data for 2010). Among the top 10 gainers in net domestic migration in 2013 to 2014, nine were also among the top 10 gainers between 2000 and 2013. These included Texas, Florida, South Carolina, Colorado, Washington, Arizona, North Carolina, Oregon and Nevada. Georgia was replaced by Oregon in the IRS 2013 to 2014 list.
However in the earlier period, Florida was the leading importer of people, while Texas, now number one, ranked second. However, Florida could challenge Texas in the future, if that state's in-migration numbers suffer substantially from the oil bust. Net domestic migration continues to focus on the South and West, with each region accounting for five of the top 10 states.
There is also similarity among the largest exporters of people, though somewhat less so. Among the top five domestic migrant exporters, four ranked in the top five between 2000 and 2013. New York, California, Illinois and New Jersey appeared in both lists, while Pennsylvania replaced Texas in the 2013-2014 IRS data.
Among the 10 greatest losers in net domestic migration, five were in the Northeast, three were in the Midwest, one was in the South and one in the West.
| RESIDENTS & DOMESTIC MIGRANTS: ANNUAL INCOME: 2014 | |||||
| State | All | Out-Migrants | In-Migrants | Net Domestic Migration | State Attraction Ratio (In-migrants per 100 out-migrants) |
| Alabama | $26.0 | $23.3 | $23.1 | (3,800) | 96.1 |
| Alaska | $35.8 | $26.5 | $24.8 | (7,800) | 80.1 |
| Arizona | $28.7 | $28.3 | $31.4 | 22,900 | 113.8 |
| Arkansas | $26.0 | $22.0 | $22.3 | (4,400) | 93.2 |
| California | $36.1 | $43.2 | $38.8 | (57,900) | 88.5 |
| Colorado | $36.0 | $32.7 | $33.3 | 29,500 | 119.9 |
| Connecticut | $50.1 | $56.0 | $53.7 | (17,500) | 78.3 |
| Delaware | $32.9 | $33.9 | $34.4 | 1,700 | 106.2 |
| District of Columbia | $56.9 | $53.9 | $46.7 | (4,400) | 89.7 |
| Florida | $32.9 | $28.7 | $42.9 | 114,400 | 126.7 |
| Georgia | $28.0 | $25.4 | $25.2 | 13,900 | 105.6 |
| Hawaii | $31.0 | $24.1 | $27.8 | (4,000) | 93.0 |
| Idaho | $25.3 | $22.1 | $25.3 | 6,000 | 112.8 |
| Illinois | $34.8 | $39.8 | $34.3 | (82,000) | 67.2 |
| Indiana | $27.3 | $27.1 | $25.0 | (6,000) | 94.8 |
| Iowa | $30.5 | $27.4 | $24.4 | (2,500) | 95.7 |
| Kansas | $31.1 | $25.2 | $27.1 | (11,000) | 87.3 |
| Kentucky | $26.1 | $24.3 | $23.2 | (7,800) | 91.5 |
| Louisiana | $28.9 | $25.8 | $25.2 | (8,000) | 90.9 |
| Maine | $29.6 | $35.5 | $35.0 | 1,500 | 106.3 |
| Maryland | $38.9 | $38.5 | $31.2 | (3,000) | 98.0 |
| Massachusetts | $46.3 | $45.3 | $45.7 | (19,200) | 84.3 |
| Michigan | $29.9 | $30.8 | $30.8 | (24,200) | 82.6 |
| Minnesota | $35.8 | $39.8 | $32.0 | (9,000) | 89.9 |
| Mississippi | $23.0 | $20.8 | $20.3 | (8,200) | 87.6 |
| Missouri | $29.4 | $27.5 | $26.7 | (7,200) | 94.2 |
| Montana | $29.5 | $26.0 | $28.8 | 3,300 | 111.9 |
| Nebraska | $30.6 | $28.0 | $23.7 | (2,400) | 94.2 |
| Nevada | $30.9 | $27.6 | $33.2 | 15,700 | 117.0 |
| New Hampshire | $38.0 | $38.2 | $43.3 | 1,000 | 102.9 |
| New Jersey | $42.6 | $48.3 | $42.0 | (46,000) | 75.9 |
| New Mexico | $25.9 | $25.4 | $25.7 | (9,800) | 84.6 |
| New York | $42.7 | $44.6 | $45.0 | (126,800) | 65.4 |
| North Carolina | $28.1 | $26.4 | $29.3 | 20,900 | 108.9 |
| North Dakota | $38.8 | $30.6 | $25.8 | 5,600 | 120.2 |
| Ohio | $29.9 | $32.3 | $28.8 | (18,300) | 89.2 |
| Oklahoma | $29.1 | $24.7 | $22.9 | 3,300 | 104.1 |
| Oregon | $31.2 | $28.7 | $30.4 | 18,700 | 122.3 |
| Pennsylvania | $33.7 | $37.2 | $34.1 | (27,500) | 86.4 |
| Rhode Island | $34.8 | $35.5 | $34.5 | (3,900) | 85.1 |
| South Carolina | $26.8 | $24.9 | $31.8 | 30,100 | 127.3 |
| South Dakota | $31.5 | $24.6 | $28.3 | (400) | 98.5 |
| Tennessee | $27.5 | $25.0 | $27.9 | 16,400 | 111.2 |
| Texas | $31.7 | $30.6 | $27.4 | 229,300 | 156.3 |
| Utah | $26.4 | $23.2 | $27.1 | (2,800) | 96.1 |
| Vermont | $32.2 | $37.6 | $33.6 | (1,200) | 92.4 |
| Virginia | $37.0 | $34.4 | $32.5 | (25,300) | 90.1 |
| Washington | $36.0 | $30.5 | $32.6 | 27,000 | 116.4 |
| West Virginia | $25.6 | $24.8 | $23.7 | (3,700) | 90.0 |
| Wisconsin | $31.5 | $32.0 | $29.8 | (10,300) | 88.6 |
| Wyoming | $40.2 | $27.1 | $30.9 | (1,400) | 94.9 |
| United States | $33.4 | $33.0 | $32.4 | ||
| Income in 000s | |||||
| Data from IRS Gross Migration File (https://www.irs.gov/uac/soi-tax-stats-migration-data-2013-2014) | |||||
Wendell Cox is principal of Demographia, an international pubilc policy and demographics firm. He is a Senior Fellow of the Center for Opportunity Urbanism (US), Senior Fellow for Housing Affordability and Municipal Policy for the Frontier Centre for Public Policy (Canada), and a member of the Board of Advisors of the Center for Demographics and Policy at Chapman University (California). He is co-author of the "Demographia International Housing Affordability Survey" and author of "Demographia World Urban Areas" and "War on the Dream: How Anti-Sprawl Policy Threatens the Quality of Life." He was appointed to three terms on the Los Angeles County Transportation Commission, where he served with the leading city and county leadership as the only non-elected member. He served as a visiting professor at the Conservatoire National des Arts et Metiers, a national university in Paris.


