
New urbanist utopians love to decry Americans’ love of the single family home, and to extol the virtues of a higher-rising denser city as more efficient and environmentally responsible. Without expounding on the immensely destructiveness of such a utopian viewpoint to physical and psychological well-being of a large majority of people, nor of the scientific absurdity of the claim of efficiency and environmental goodness, I will for now present only some maps and data of what the real world is like.
People vary in needs and preferences over the life course. It is indeed the case that young adults, usually unmarried (and yes increasingly for a longer time), and perhaps a fair share of elderly widows or widower, or even empty-nesters, together as many as one-third of persons, may prefer and enjoy an urban lifestyle, and apartment living. These are the people, for example that are flocking into a growing Seattle, bidding up the price of housing, to take up jobs at Amazon and similar businesses, and even supporting planning calls for replacing a sizeable share of single family homes, with higher density housing.
But this phenomenon ignores the further housing reality that the other two-thirds of people are in families, with children or other relatives, or even unrelated people who rent rooms, who much prefer homes on lots, with some private space. Even those young singles jumping into downtown Seattle may marry, have children, and as they have done generation after generation, and look, yes, for homes with yards and space for a car, so they can go and explore the environs beyond the city.
What’s out there?
Table 1 summarizes the national data on population living in different kinds of housing. For whatever reasons you will not find this information in any census publication or city or state reports! They are quite difficult to find and require gleaning from PUMS (Public Use Micro Sample) data.
| Table 1 Shares of population by Type of Housing, 2010 | |||||
| Type | # Units | % of Units | Population | % of population | Ave HH Size |
| Single family | 76.5 | 67.4 | 216.6 | 72.2 | 2.83 |
| Small apartments | 15 | 13.3 | 37.7 | 12.6 | 2.51 |
| Large apartments | 15.9 | 14 | 28.3 | 9.4 | 1.78 |
| Mobile Homes | 7.4 | 6.5 | 17.2 | 5.7 | 2.2 |
| ALL | 114 | 100 | 299.5 | 100 | 2.6 |
| Units and population in millions | |||||
The key information is that single family homes. Including duplexes for which each unit a separate address account for 67.4 % of occupied housing units in 2010 (61.6 % in totally separate structures), and housed a convincing 217 million, 72.2 % of the population (not including those in group quarters), at an average household size of 2.83. Note well: that’s almost 3 out of 4!
Mobile homes are mostly banned from big cities, but in the real world of providing shelter for the less affluent in many areas, they are 6.5% of units, housing over 17 million, another 5.7% of the population, at an average household size of 2.2.
About 31% of units, 13.3% in structures with 2 to 9 units, and 14% in structures with 10 or more units, are in apartments, and house 22% of the population (12.6 in the smaller structures, 9.4 in the larger) at an average household size of 2.5 and 1.8 respectively, or 2.2 for all apartments.
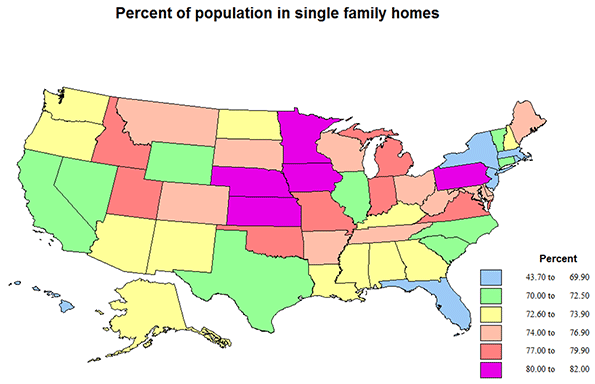
The relative importance of single family homes and of apartments varies significantly across states (and cities or counties if we had the data), but this is best seen with the help of the included maps.
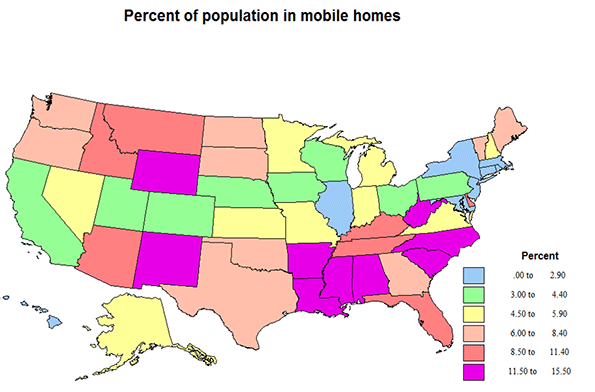
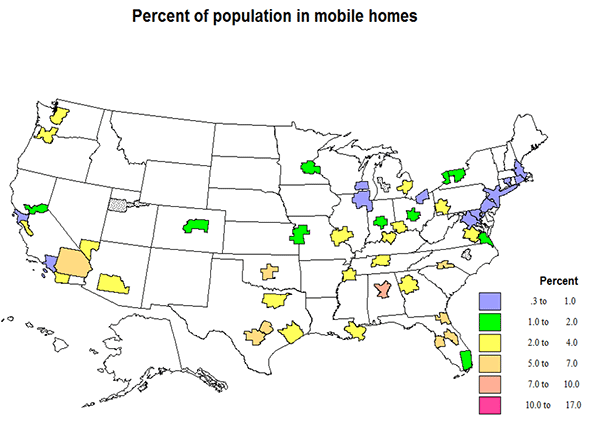
It is interesting to start with mobile homes, to find out where they are most common. In 11 states over 10% of people live in mobile homes. The highest is 15.5% in SC, followed by NM at 13.9, WY, 13.2, WV, 12.9, MS, 12.6, then AL and NC, 12.1, states with high shares of less affluent people. Most higher shares are across the warmer south, but are also high in the northern Rockies. Indeed the lowest shares are across the middle of the country from CA to New England. The lowest share is DC at 0.0, then HI, .2, but are also quite low in MA, .7, CT, .9, RI, and NJ at 1.0, mostly small and very metropolitan states. Typical states close to the average of 5.7% are AK and NH at 5.7, MO, 5.5., and NV, 5.2.
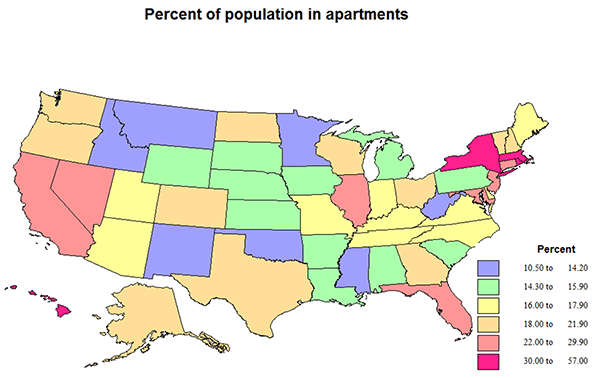
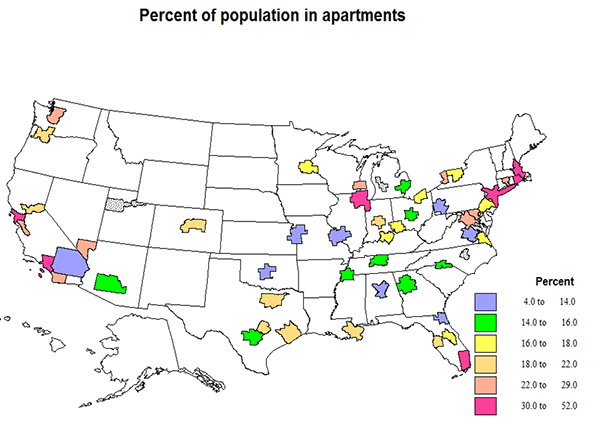
Apartment living is quite a bit higher in selected states. The District of Columbia is by far the highest at 56%, as it is the central city of a giant metropolitan region. Next highest is New York at 46%, actually a consequence of New York City. These are followed by MA, 35, RI, 34, HI, 34 and NJ, 30. HI may be expected to have higher apartment shares, due to the high value of desirable land, MA, RI and NJ, because of very high metropolitan shares, including New York City suburbs. Moderate apartment shares occur in CA, 24, IL, 27, FL, 24, and NV, 25. Average shares of 22% occur in TX, VT, NH, and MD. At the other extreme, apartment living is amazingly low (under 14%) in WV, 10.5, ID 11.9, NM, 12.9, MT, 13.5, OK, 13.8, and MN, 14—mostly less metropolitan.
Single family homes dominate most of the country. The highest shares, over 80, are for IA, KS, MN and NE, a contiguous sub region of the north central US, and somewhat surprising, PA. Actually not surprising: PA, 18, MD, 21, DE, 15, and VA, 10, have unusually high shares of “attached” 1 unit row houses with separate numbers and yards – not the image of single family home in most of the country. Shares are almost 80 in Mormon UT and ID, and in MI. In general, with the exceptions of NY and most of New England, shares are higher across the northern and central US than across the south, perhaps because of the greater shares of mobile homes to the south. The lowest shares are in the states with the highest shares of apartments, DC, NY, but still 52%, MA, 64, RI, 65, HI, 66, and FL, 67, but already over 2/3! Right at the US average of 72% are AK, AZ, CA, NC, NH, TX and WY, a not geographically obvious or coherent set!
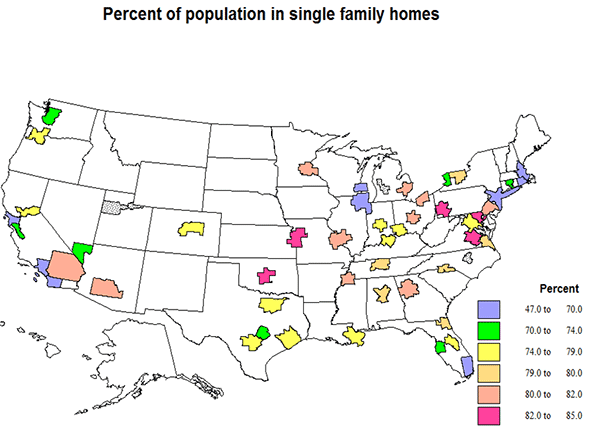
The story for metropolitan areas
Data are available for large “millionaire” metropolitan areas. These offer few surprises, reinforcing the story from the data for states. Table 2 distinguishes the information for 52 large metro areas, and the rest of the US. The large metro areas contain a little over half of the US population (51%).
| Table 2 Population by housing types, large metropolitan areas and the rest of the US | ||||||||
| Metro | Rest of US | |||||||
| Type | Units | Population | % of Pop | Ave HH Size | Units | Population | % of Pop | Ave HH Size |
| Sing Family | 40.2 | 112 | 73 | 2.78 | 36.3 | 104 | 71 | 2.89 |
| Apartments | 17.7 | 37 | 24 | 2.1 | 11.8 | 29 | 20 | 2.4 |
| Mobile | 1.7 | 4 | 2.6 | 2.2 | 5.8 | 13 | 9 | 2.2 |
| All | 59.6 | 153 | 100 | 2.57 | 53.9 | 146 | 100 | 2.71 |
The share of population in single family homes differs only slightly between the large metro areas and the rest of the country, but the share of people in apartments is much higher in the big metro areas (24 to 20), while the share of people in mobile homes is much higher outside of the large metro areas (9 versus 2.6). The slightly higher single family share for the metro areas is a little misleading, however, because the metro set has a much higher share of an intermediate category of housing, “1 unit attached”, meaning row houses, separate addresses and yards, but of higher density than the detached single family home.
Mobile home shares are especially lower in the biggest metro areas, most notably megalopolis, as Boston, .2 and Washington DC, .3. The highest metro share are in the south, e.g., Birmingham, 8, Tampa, 7, Riverside, 6, Jacksonville, and San Antonio, 6.
The share of the population in single family homes is not surprising for the most part, that is, lowest (under 70%) in most of the older and largest metro areas, NY, Boston, Chicago, San Francisco, Los Angeles, and Miami, and highest in intermediate sized across most of the country. The highest shares ae for Kansas City, 84, Pittsburgh, Oklahoma City and Richmond, 83, and Atlanta, Columbus, Detroit and St. Louis, 82. The cases of Philadelphia, Baltimore, Washington, and Richmond are special, as the high single family shares are actually a result of high shares of row housing, e.g., 32% in Philadelphia, 24 in Baltimore, 20 in Washington, 10 in Richmond.
The population shares in apartments also reflect the size and importance of the metro area, with the addition of Miami, highest in New York Metropolitan Area, 41, (52% in the NYC part), San Francisco-Oakland, 33, Chicago, 32, Providence,33, Boston, 41, LA-Anaheim, 31.5 (33 in the LA part), and Miami, 30. The lowest shares tend to be in the interior eastern US, plus Richmond in the east and Riverside in the west: Birmingham and Oklahoma City, 12, Riverside and Pittsburgh, 13, and Jacksonville, Kansas City, Richmond and St. Louis, 14. Metro areas in a middle range (23 to 25%) include Seattle, Hartford, New Orleans, Baltimore, Buffalo, Las Vegas, and San Jose, middle sized and scattered across the country.
Average household size
Average household size in part reflects the kind of housing, but equally the age and ethnic composition of the population, not part of this data set. The average US number is 2.63, but 2.57 in the metro areas, and 2.71 for the rest of the US. It is highest for single family homes, 2.83 for the US, 2.78 in the metro set, 2.89 for the rest of the country, 2.2 for apartment dwellers and 2.2 for mobile home folks. As expected average values for smaller apartment structures (2 to 9) is higher in the smaller buildings than in larger ones, 2.5 compared to 1.8.
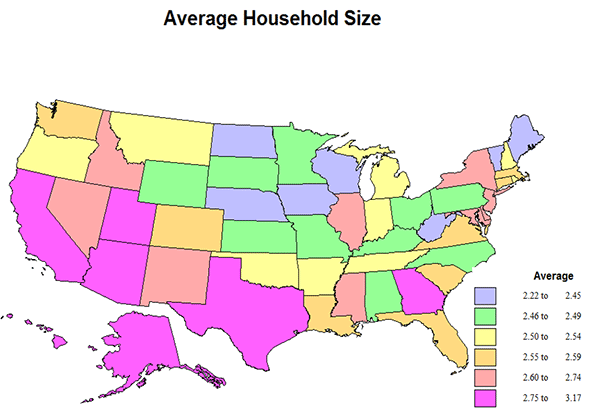
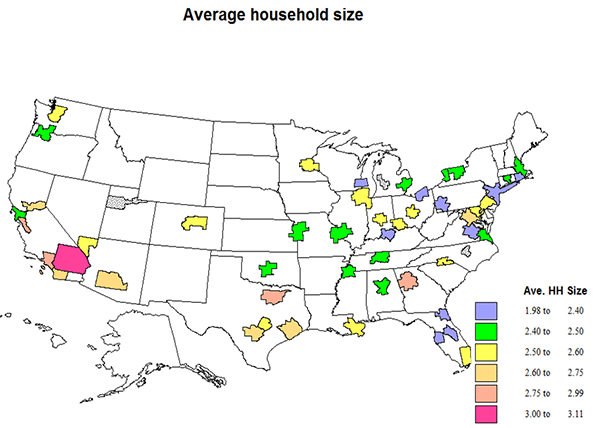
Average values for states vary from 2.22 in ND (due to a combination of an influx of energy workers, high share of college students, and remaining seniors), 2.26 in the District of Columbia (large share of single persons), 2.35 in ME, 2.36 in IA, and 2.237 in WV (older populations) to the very highest in UT (well..) at 3.17, then CA at 2.95, AK 2.86, AZ and TX, 2.84, reflecting ethnic composition. Right in the middle are NY and DE, 2.63. Metro area average household size varies from a high of 3.1 for Riverside, then 3 for Anaheim, 2.91 for San Jose, 2.83 for Los Angeles and Dallas, all with high Hispanic populations and levels of young immigrants. At the low size end are NY at 1.98, the only area under 2, reflecting the high share of apartments and of singles, particularly in New York City, then Jacksonville, 2.23, Tampa, 2.28, Richmond, 2.35, and Orlando, 2.36, -- in Florida a result of in-migration of older households without children. The middle areas at 2.57 are Las Vegas, Miami, and Minneapolis.
Conclusion
There is no likelihood of the demise of the single family home, or even of significant attrition, simply because the large majority of people demand them. But there will be some reduction in a few areas where demand for housing is high but the land supply constrained, geographically or by growth management, as in Seattle, coastal California, New York, and Boston, with high shares of non-families. On the other hand, continuing concentration of population in giant metropolitan areas is not inevitable, as a costs drive people elsewhere. In the end, barring a national clampdown on suburbs, the balance of housing types may not change greatly.
Richard Morrill is Professor Emeritus of Geography and Environmental Studies, University of Washington. His research interests include: political geography (voting behavior, redistricting, local governance), population/demography/settlement/migration, urban geography and planning, urban transportation (i.e., old fashioned generalist).


