
New data from the Census indicates that population growth and domestic migration patterns have continued to move away from the East and the Midwest to the South and West, at accelerated rates. Equally important, pre-Great Recession interstate mobility rates have been restored.
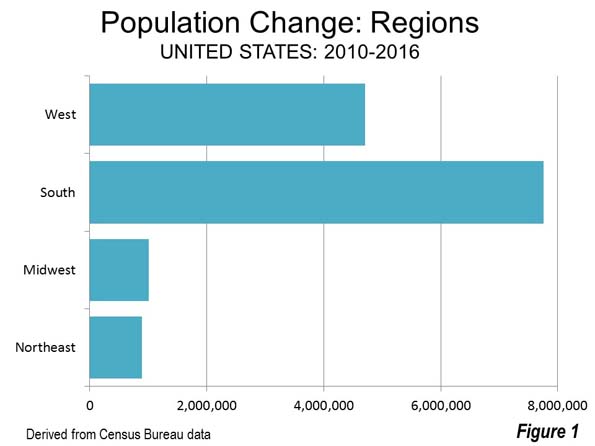
The just released Census Bureau population estimates for the nation, states and the District of Columbia indicate a population increase for the South of 7.7 million between 2010 and 2016. The West gained 4.7 million. By contrast, the Midwest grew 1.1 million, while the East was even lower, at 900,000 (Figure 1).
Combined, the South and West accounted for 87 percent of the national growth. In 2011, the South and West captured 82 percent of the national growth. By 2016, the South and West had risen to 94 percent of the national population increase. The South, alone had 57 percent of the growth, up from 52 percent in 2011. The West also had a strong gain, from 31 percent in 2011 to 36 percent in 2016.
Domestic Migration
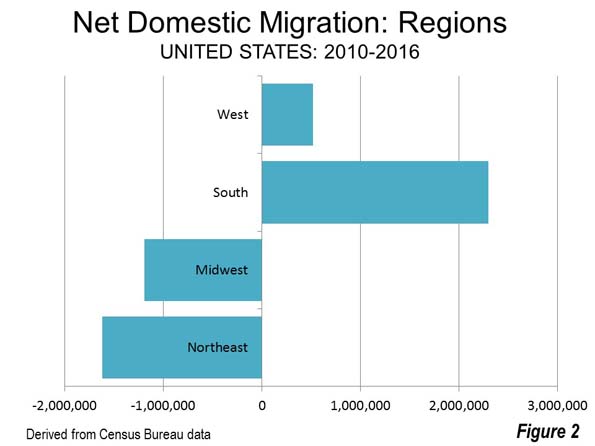
Not surprisingly, the South and West also dominated net domestic migration --- the movement of residents from one state to another (Figure 2). The South attracted 2.3 million people from other regions, more people than live in the cities (municipalities) of Philadelphia and Boston combined. The South dominated domestic migration even more than population growth, attracting more than four times the new residents as the West, which had a net inflow of more than 500,000. The Northeast lost 1.6 million domestic migrants, nearly as many people as live in Rhode Island and Vermont. The loss in the Midwest was 1.2 million, more people than live in the cities (municipalities) of Minneapolis, Cleveland and St. Louis combined.
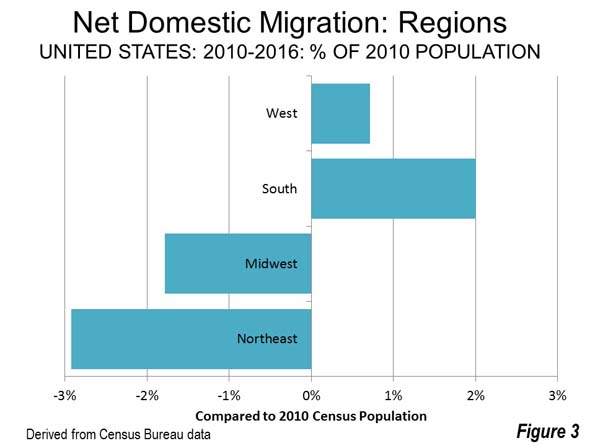
The South also led in the percentage of net domestic migrants in relation to the 2010 population, at 2.0 percent, nearly three times that of the West (0.7 percent). The net loss in the Midwest was 1.8 percent, while the East sustained a loss of 2.9 percent (Figure 3)
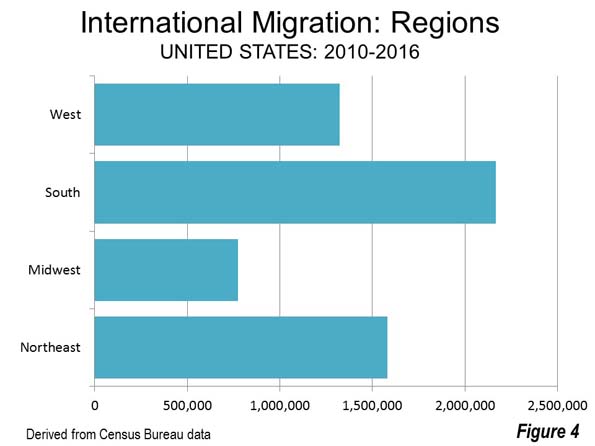
Perhaps most surprisingly, the South also led in population gains from immigration. Between 2010 and 2016, the South added 2.2 million foreign migrants. The East added 1.6 million, the West 1.3 million and the Midwest 800,000 (Figure 4).
State Population Trends
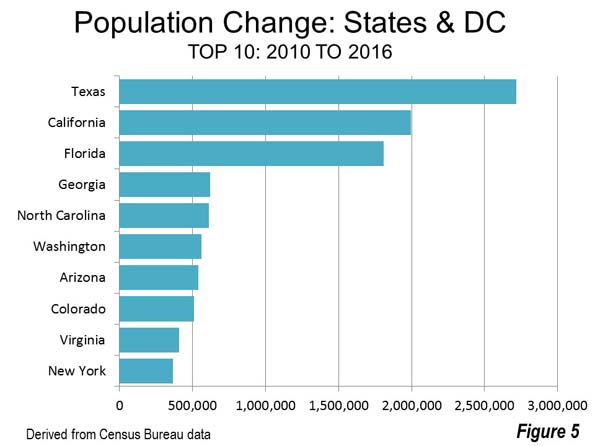
Texas has led the nation in total population growth. Total population growth includes the natural change (births minus deaths), international migration and net domestic migration. Texas added 2.7 million residents, a 10.8 percent increased compared to its 2010 population. This is more than double the national rate of 4.7 percent. California was well behind, with a gain of 2.0 million, despite having started the decade with a 50 percent higher population. California’s growth rate was 5.3 percent.
Florida added the third largest number of new residents, at 1.8 million, for a 9.6 percent growth rate from 2010. After that the gains were much less. Georgia and North Carolina gained somewhat more than 600,000. Washington, Arizona and Colorado added between 500,000 and 600,000 residents. Virginia and New York rounded out the top ten (Figure 5). New York generated large numeric, but small proportional increases early in the decade (1.9 percent), the result of its fourth largest population, after California, Texas, and Florida.
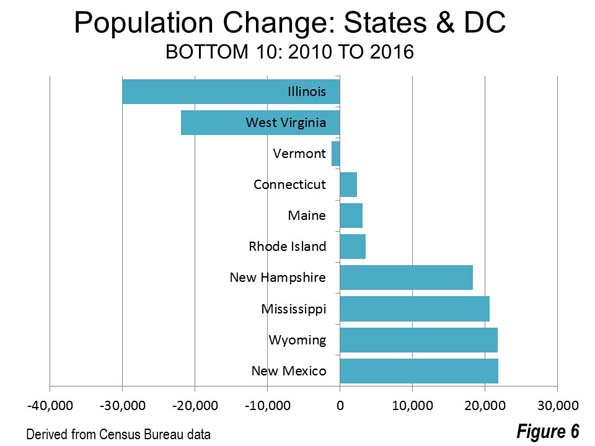
Three states suffered population losses over the period. Illinois lost 30,000 residents and West Virginia lost 20,000. Vermont lost 1,000 and was joined by New England neighbors Maine, New Hampshire, Connecticut and Rhode Island in the bottom 10. However, Maine has begun to gain again (below). The bottom 10 included one southern state, Mississippi and two western states, Wyoming and New Mexico (Figure 6)
State Domestic Migration Trends
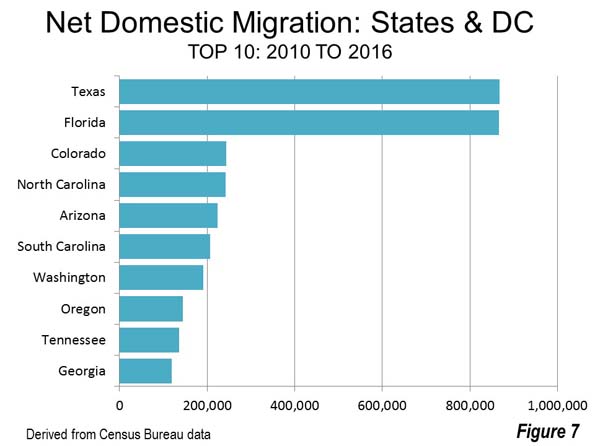
Throughout the decade, Texas has led in net domestic migration. But the race is much closer, with the Longhorn state leading second ranked Florida by only 500. Both states have gained between 866,000 and 867,000 net new residents from domestic migration since 2010 (Figure 7). Perhaps due to the energy downturn, domestic migration to Texas dropped by more than one-quarter, while Florida continued led the nation for the second straight year. In 2016, Florida added 207,000 net domestic migrants, compared to the Texas gain of 126,000. With the improving prospects for energy under the Trump administration, the competition could be stiff between the two states in the years to come.
Other net domestic migration leaders added between 200,000 and 250,000, including Colorado, North Carolina, Arizona and South Carolina. Washington, Oregon, Tennessee and Georgia added between 100,000 and 200,000 net domestic migrants, as did Nevada, which ranked 11th, a remarkable turnaround. Nevada as well as Arizona, Georgia suffered serious setbacks during the Great Recession, but now show signs of significant recovery.
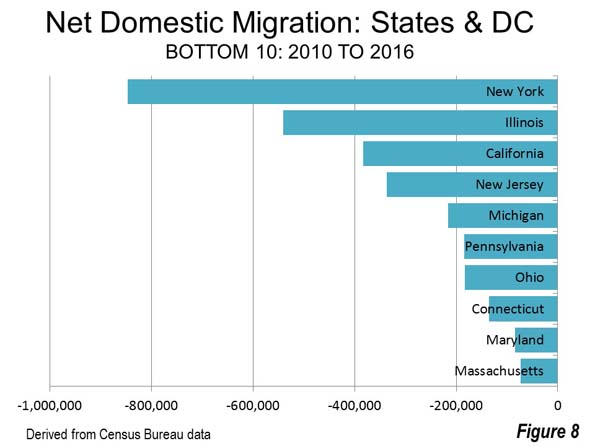
The East and Midwest had a near monopoly on the bottom 10 in net domestic migration. New York lost 867,000 net domestic migrants, while Illinois lost 540,000. California’s loss was 383,000. New Jersey lost 336,000 and Michigan 216,000. Pennsylvania, Ohio and Connecticut lost between 100,000 and 200,000, while Maryland and Massachusetts lost between 70,000 and 100,000 (Figure 8).
New York had the largest net domestic migration loss in 2016, at 191,000. Illinois lost 114,000, closely followed by California, at 109,000.
Highlights
The data also indicates significant shifts in growth rates during the decade.
The largest drop was in the East, where the total population gain dropped 90 percent, from 245,000 in 2011 to 24,000 in 2016. In the Midwest, growth dropped from 174,000 to 103,000. Meanwhile, population rose 1,281,000 in the South, up from 1,199,000 in 2011. The West had the largest gain, from 697,000 to 822,000.
New York’s population gain has declined every year, from 117,000 in 2011 to 27,000 in 2015 and a loss of 2,000 in 2016. Pennsylvania lost 8,000 residents in 2016, down from a 32,000 gain in 2011.
Not all states in the West had positive trends. California gained only 256,000 in 2016, down from 344,000 in 2011. California’s gain dropped nearly 20 percent in just the last year. In 2016, California’s percentage growth trailed that of the United States for the first time in the decade (6.6 percent compared to the national rate 7.0 percent). Between 2011 and 2015, California’s average, at 8.6 percent, was well above that of the nation (7.3 percent).
The states to which Californians migrate in the greatest numbers gained as a result. Nevada’s population gain nearly quadrupled between 2011 and 2016, Idaho, Oregon and Arizona approximately doubled, while strong improvements were registered in Washington, Colorado and Utah.
Florida added 367,000 new residents, a strong gain from the 2011 level of 247,000, while South Carolina’s gain nearly doubled. North Carolina, Georgia, Tennessee and Texas posted healthy increases. However, Maryland’s growth fell by more than one-half (55,000 to 21,000), while Virginia saw its gain drop from 84,000 in 2011 to 44,000 in 2016.
Pervasiveness of Declining Growth
At the national level, the annual growth rate continues to trend downward. In 2011, the United States added 0.75 percent to its population. By 2016, the rate had dropped to 0.70 percent. In 30 states, plus the District of Columbia, the growth rate dropped between 2011 and 2016.
On the other hand, 20 states had stronger growth rates in 2016 than in 2011. Given the utter domination of the trends by the South and West, it is surprising that seven of these states are outside the West.
In the East, the New England states of Maine, New Hampshire and Rhode Island had higher growth rates in 2016. At the same time, Vermont, where similar trends might be anticipated, slipped from modest growth in 2011 to a decline in 2016.
Four Midwestern states also grew faster in 2016 than in 2011. These include Michigan, Missouri, Nebraska and Ohio. Michigan, the only state to reach more than 10 million and then fall below, has gained four years in a row, though remains below 10 million.
Among these seven states, only Nebraska exceeded the national growth rate in 2016.
Natural Increase Down, Mobility Up
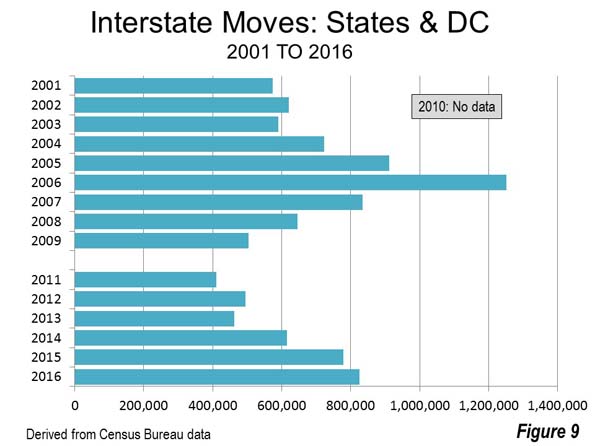
The natural population growth rate (births minus deaths) dropped from 4.7 percent in 2011 to 3.8 percent in 2016. At nearly 20 percent (18.8 percent), this is a huge reduction in just five years. At the same time the Great Recession-interrupted interstate mobility seems to have recovered. In 2016, there were 825,000 interstate moves, more than double the post-2000 low of 411,000 in 2011. The 2016 interstate move figure was greater than all but the three largest Housing Bubble years, 2005, 2006 and 2007. The 2016 moves also exceeded the 2001 to 2009 average by more than 10 percent (Figure 9).
Back to the Future
As we get farther from the Housing Bust and the Great Recession, population growth and domestic migration seem to be increasingly restored to prior trends around the nation.
Wendell Cox is principal of Demographia, an international public policy and demographics firm. He is a Senior Fellow of the Center for Opportunity Urbanism (US), Senior Fellow for Housing Affordability and Municipal Policy for the Frontier Centre for Public Policy (Canada), and a member of the Board of Advisors of the Center for Demographics and Policy at Chapman University (California). He is co-author of the "Demographia International Housing Affordability Survey" and author of "Demographia World Urban Areas" and "War on the Dream: How Anti-Sprawl Policy Threatens the Quality of Life." He was appointed to three terms on the Los Angeles County Transportation Commission, where he served with the leading city and county leadership as the only non-elected member. He served as a visiting professor at the Conservatoire National des Arts et Metiers, a national university in Paris.
Photo of Zion National Park in Utah, the nation's fastest growing state by Tobias Alt - Own work, GFDL, Link


