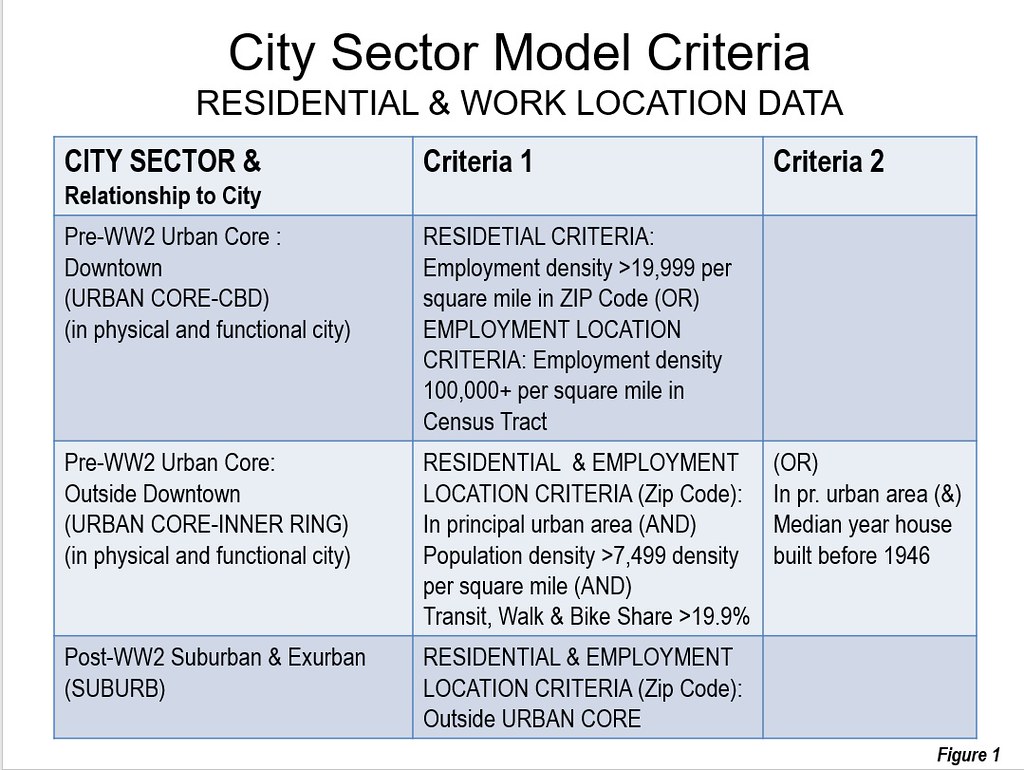
A review of the most recent US Census Bureau population estimates and components of population change indicates that US residents are overwhelmingly moving to the most suburban cities (metropolitan areas). We previously rated the 53 major metropolitan areas (over 1 million population) using the City Sector Model (see America’s Most Suburbanized Cities), which classifies small areas (zip codes) into five urban core and suburban categories based on factors such as density, transit use, and age of housing stock.(Figure 1). This article examines net domestic migration based on the extent of suburbanization identified in the previous article.
In this decade to date, the 30 most suburbanized cities gained 2.3 million net domestic migrants. These cities are from 94.8 percent to 100.0 percent suburban. The 23 cities that are less suburban had, overall, loss of 2.1 million net domestic migrants. Overall, the 53 major metropolitan areas gained 200,000 net domestic migrants.
The First Quintile: 100 Percent Suburban Cities
A total ten cities are rated 100 percent suburban this means that they have virtually no population densities high enough to qualify for urban cores in any zip code. This indicates that virtually all of their development has occurred during the post-World War II period and that any historical high density zip codes have experienced a decline to below 7500 persons per square mile. The most suburban of these cities is determined by the percentage of exurban population, since there is a 10 way tie for 100 percent suburbanization. This article examines net domestic migration trends in relation to the suburban character of the major metropolitan areas. Net domestic migration counts the number of US residents who move between counties (which are also the building block components of metropolitan areas).
Charlotte is the most suburban and the other nine cities that are 100 percent suburban all located in the South or West (Table 1).

| Table 1 | |
| Most Suburban Cities: (Metroplitan Areas) | |
| 1 | Charlotte, NC-SC |
| 2 | Riverside-San Bernardino, CA |
| 3 | Raleigh, NC |
| 4 | Orlando, FL |
| 5 | Birmingham, AL |
| 6 | Jacksonville, FL |
| 7 | Phoenix, AZ |
| 8 | San Antonio, TX |
| 9 | Tampa-St. Petersburg, FL |
| 10 | Tucson, AZ |
| Out of 53 with more than 1,000,000 population | |
For the purposes of analyzing domestic migration, these 10 cities are considered to be the top quintile in suburbanization. With 53 cities overall, two quintiles are one city short, the first and the fifth.
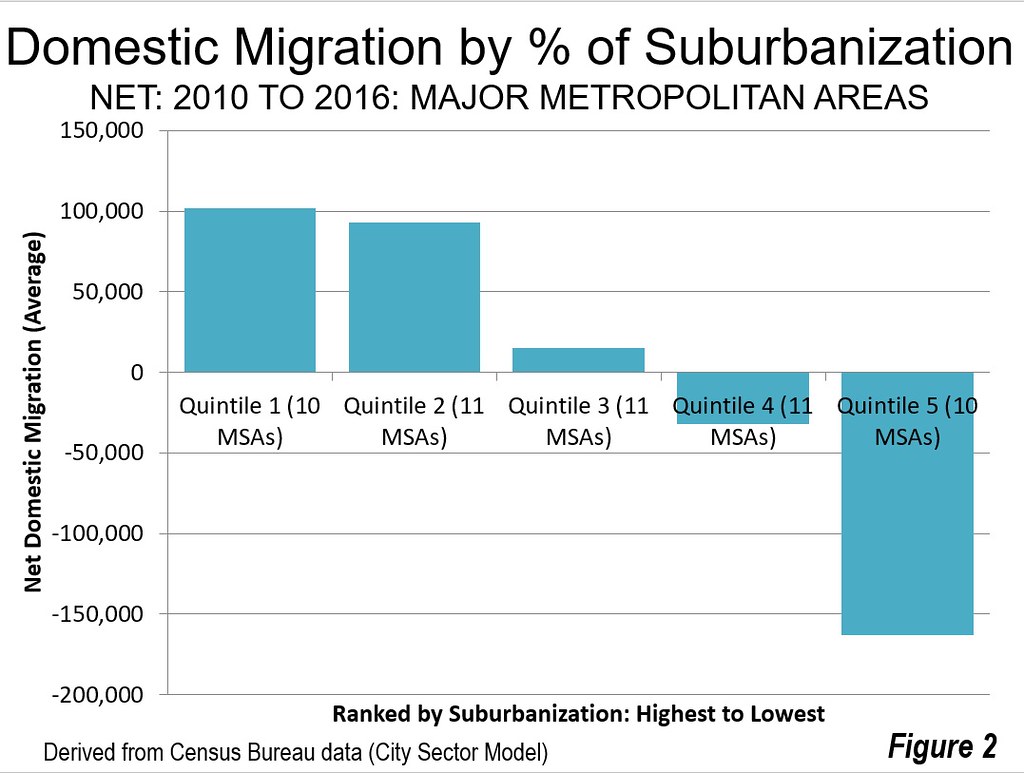
The all suburban cities had an average positive net domestic migration of 93,000 persons between the 2010 census (April 1) and the 2016 Census Bureau population estimates (Figure 2). Their total net domestic migration was 1,016,000.
Not all of the most suburbanized cities experienced positive net domestic migration. Birmingham, rated as the fifth most suburbanized city, lost 5000 net domestic migrants. But that’s an exception. Five fully suburban cities gained more than 100,000 net domestic migrants, including Phoenix (215,000), Tampa – St. Petersburg (163,000), San Antonio (146,000), Charlotte (143,000) and Orlando (132,000). Three of the other all suburban cities gaining domestic migrants added more than 50,000 including Raleigh, Jacksonville and Riverside – San Bernardino). Tucson gained only 3000 (Table 2).
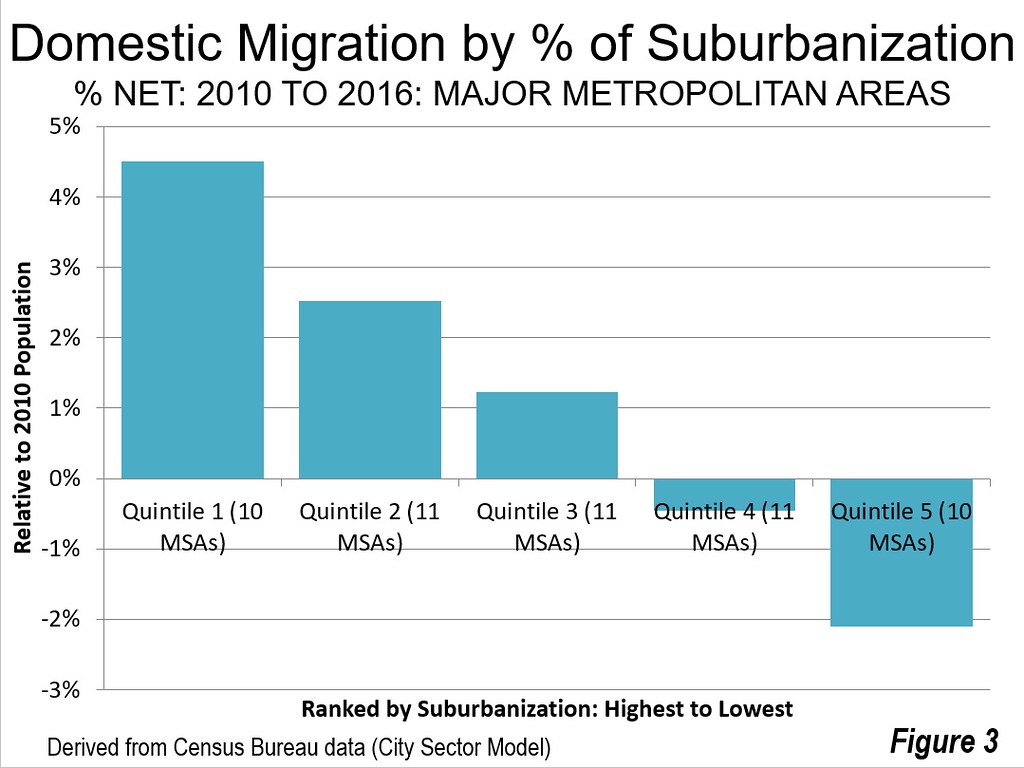
Overall the net domestic migration averaged 4.5 percent relative to their 2010 Census population (Figure 3). Raleigh had the highest percentage net domestic migration gain at 8.3 percent, followed by San Antonio at 6.9 percent, Charlotte at 6.5 percent and Orlando at 6.1 percent (Figure 3).


The Second Quintile
The second quintile includes cities that are from 97.6 percent suburban to 99.8 percent suburban.
With 11 cities, the second quintile attracted more net domestic migrants than the top quintile (1,023,000), which has only 10 cities. The per city average was somewhat lower than in the first quintile, at 93,000. Five of the cities in the second quintile added more than 100,000 net domestic migrants, including Dallas – Fort Worth at 304,000 (the highest of any city), Houston at 283,000 Austin at 192,000, Atlanta at 153,000 in Nashville at 104,000. Three cities in the quintile lost net domestic migrants, including San Jose, Virginia Beach – Norfolk and Memphis.
The net domestic migration in second quintile averaged 2.5 percent of the 2010 population. Austin had the highest net domestic migration gain of any city at 11.2 percent. Nashville gained 6.2 percent.
Like the first quintile, all cities in the second quintile are in the South or West.
The Third Quintile
The third quintile includes cities that are from 91.2 percent suburban to 97.2 percent suburban.
The third quintile had an average net domestic migration of 15,000 per city and an average of 66,000 overall for the 11 cities. The largest gainers were Denver, at 155,000 and Oklahoma City at 52,000. Only two of the city’s lost net domestic migrants, Detroit at 131,000 and Miami at 7000.
On average, the third quintile added 1.2 percent to their 2010 population through domestic migration. The largest gain was in Denver, at six percent, followed by Oklahoma City at 4.2 percent. The largest loss was in Detroit at 3.0 percent.
The third quintile has cities from the Midwest as well as from the South and the West.
The Fourth Quintile
The fourth quintile includes cities that are from 84.1 percent suburban to 90.0 percent suburban.
Overall these cities lost 352,000 net domestic migrants, for an average of a 32,000 loss per city. The largest gainers were Seattle, at 106,000 and Portland at 94,000. The growth of these cities is being strengthened by the strong outmigration from California with its horrendously expensive housing costs. The largest loser in the fourth quintile was Los Angeles, at 373,000 which ranks it the third largest losing major metropolitan area.
Overall, the average city lost 0.5 cent of its population to net domestic migration. The largest gain was in Portland, at 4.3 percent and in Seattle at 3.1 percent. The largest losses were in Hartford, 3.9 percent and Rochester at 3.0 percent.
The Fifth Quintile
The fifth quintile includes cities that are from 83.3 percent suburban to New York, at 46.7 percent suburban ; the only city with a dominant urban core. Only one of these cities, San Francisco – Oakland gained net domestic migration, at 43,000 the largest net domestic migration losses were in New York at minus 903,000 and Chicago at minus 409,000.
San Francisco – Oakland had a net domestic migration gain of 1.0 percent relative to its 2010 population, though in the last year has fallen into decline as house prices continue to rise to the stratosphere. New York had the largest percentage loss of any city due to net domestic migration at minus 4.6 percent. Chicago’s loss was minus 4.3 percent.
Moving to the Suburbs and to the Most Suburban Cities
A couple of months ago we and others reported on the resurgence of suburban population growth in net domestic migration compared to that of the urban cores (see “Flight from Urban Cores Accelerates: 2016 Census Metropolitan Area Estimates”). When examined relative to the extent of suburbanization, the trend is even more significant, with strong net domestic migration to the most suburbanized cities. America continues to evolve, often not following the densification and anti-suburban proclivities of many planners and media outlets.
| Table 2 | ||||
| Domestic Migration in Relation to Suburbanization of Cities | ||||
| Major Metropolitan Areas: 2010 Census to 2016 Population Estimates | ||||
| Rank | Metropolitan Area | % Suburban | Net Domestic Migration | Net Domestic Migration % |
| 1 | Charlotte, NC-SC | 100.0% | 142,873 | 6.5% |
| 2 | Riverside-San Bernardino, CA | 100.0% | 59,453 | 1.4% |
| 3 | Raleigh, NC | 100.0% | 90,756 | 8.3% |
| 4 | Orlando, FL | 100.0% | 131,588 | 6.1% |
| 5 | Birmingham, AL | 100.0% | (5,122) | -0.5% |
| 6 | Jacksonville, FL | 100.0% | 68,237 | 5.1% |
| 7 | Phoenix, AZ | 100.0% | 215,447 | 5.1% |
| 8 | San Antonio, TX | 100.0% | 146,511 | 6.9% |
| 9 | Tampa-St. Petersburg, FL | 100.0% | 163,157 | 5.9% |
| 10 | Tucson, AZ | 100.0% | 3,372 | 0.4% |
| 11 | Nashville, TN | 99.8% | 104,331 | 6.2% |
| 12 | San Jose, CA | 99.8% | (47,033) | -2.5% |
| 13 | Houston, TX | 99.6% | 283,239 | 4.8% |
| 14 | Dallas-Fort Worth, TX | 99.5% | 304,468 | 4.7% |
| 15 | Virginia Beach-Norfolk, VA-NC | 99.5% | (41,540) | -2.5% |
| 16 | Atlanta, GA | 99.2% | 153,366 | 2.9% |
| 17 | San Diego, CA | 98.9% | (15,477) | -0.5% |
| 18 | Sacramento, CA | 98.3% | 38,745 | 1.8% |
| 19 | Memphis, TN-MS-AR | 98.1% | (36,854) | -2.8% |
| 20 | Austin, TX | 97.9% | 192,375 | 11.2% |
| 21 | Las Vegas, NV | 97.6% | 87,856 | 4.5% |
| 22 | Oklahoma City, OK | 97.2% | 51,983 | 4.2% |
| 23 | Miami, FL | 97.1% | (6,762) | -0.1% |
| 24 | Denver, CO | 96.9% | 154,847 | 6.1% |
| 25 | Grand Rapids, MI | 96.5% | 8,480 | 0.9% |
| 26 | Salt Lake City, UT | 96.5% | 2,006 | 0.2% |
| 27 | Richmond, VA | 95.6% | 21,389 | 1.8% |
| 28 | Columbus, OH | 95.3% | 29,167 | 1.5% |
| 29 | Indianapolis. IN | 95.0% | 21,365 | 1.1% |
| 30 | Kansas City, MO-KS | 94.8% | 5,866 | 0.3% |
| 31 | Detroit, MI | 93.7% | (130,532) | -3.0% |
| 32 | Louisville, KY-IN | 91.2% | 8,475 | 0.7% |
| 33 | Cincinnati, OH-KY-IN | 90.0% | (23,149) | -1.1% |
| 34 | Portland, OR-WA | 90.0% | 94,284 | 4.3% |
| 35 | Los Angeles, CA | 89.4% | (372,990) | -2.9% |
| 36 | Seattle, WA | 89.3% | 105,516 | 3.1% |
| 37 | New Orleans. LA | 89.1% | 27,417 | 2.3% |
| 38 | Hartford, CT | 88.7% | (46,980) | -3.9% |
| 39 | Rochester, NY | 88.6% | (32,196) | -3.0% |
| 40 | St. Louis,, MO-IL | 88.4% | (57,902) | -2.1% |
| 41 | Minneapolis-St. Paul, MN-WI | 86.8% | (8,015) | -0.2% |
| 42 | Baltimore, MD | 84.3% | (26,498) | -1.0% |
| 43 | Pittsburgh, PA | 84.1% | (11,742) | -0.5% |
| 44 | Washington, DC-VA-MD-WV | 83.3% | (46,264) | -0.8% |
| 45 | Cleveland, OH | 78.3% | (58,375) | -2.8% |
| 46 | Milwaukee,WI | 76.6% | (42,639) | -2.7% |
| 47 | Chicago, IL-IN-WI | 74.2% | (409,167) | -4.3% |
| 48 | Philadelphia, PA-NJ-DE-MD | 74.1% | (127,868) | -2.1% |
| 49 | Providence, RI-MA | 73.9% | (28,789) | -1.8% |
| 50 | San Francisco-Oakland, CA | 73.0% | 42,847 | 1.0% |
| 51 | Buffalo, NY | 71.0% | (22,091) | -1.9% |
| 52 | Boston, MA-NH | 64.3% | (36,483) | -0.8% |
| 53 | New York, NY-NJ-PA | 46.7% | (902,616) | -4.6% |
| Derived from 2010 Census and American Community Survey using City Sector Model | ||||
Wendell Cox is principal of Demographia, an international public policy and demographics firm. He is a Senior Fellow of the Center for Opportunity Urbanism (US), Senior Fellow for Housing Affordability and Municipal Policy for the Frontier Centre for Public Policy (Canada), and a member of the Board of Advisors of the Center for Demographics and Policy at Chapman University (California). He is co-author of the "Demographia International Housing Affordability Survey" and author of "Demographia World Urban Areas" and "War on the Dream: How Anti-Sprawl Policy Threatens the Quality of Life." He was appointed to three terms on the Los Angeles County Transportation Commission, where he served with the leading city and county leadership as the only non-elected member. He served as a visiting professor at the Conservatoire National des Arts et Metiers, a national university in Paris.
Photograph: Downtown Dallas in the metropolitan area with the largest gain in net domestic migrants (by author)


