
Just released Survey of Current Population (CPS) indicates that median household income in the United States was $59,039 in 2016 (Note). This is four percent above the 2002 level, when the ethnic surveying system was adopted. This article provides data for each of the metropolitan areas (more than 1,000,000 population), including the overall median, and figures for the largest ethnicities (White Non-Hispanic, African-American, Asian, and Hispanic. The ethnicity of households is determined by "householder," (formerly called "head of household"). The major metropolitan area data is shown in the table at the bottom of the article.
Median Household Income by Largest Ethnicity
Despite all the talk of white “privilege”, it’s actually Asian households that have by far the highest median incomes of the four largest ethnicities. It has been this way for decades, from the very earliest Census Bureau income estimates that separated out Asians. And Asians have been so successful that they are leaving the other large ethnicities "in the dust."
According to the Census Bureau, Asians are persons "having origins in any of the original peoples of the Far East, Southeast Asia, or the Indian subcontinent, including, for example, Cambodia, China, India, Japan, Korea, Malaysia, Pakistan, the Philippine Islands, Thailand, and Vietnam." In 2016, Asian household median household income was $81,431, compared to $65,041 for White Non-– Hispanic households.
Asian (alone) income has been separately estimated since 2002 when it was 12 percent higher than the median income of White Non-– Hispanic (alone) households. Even before that, from 1987 to 2001, Asian income was reported along with that of Pacific Islanders and was 14 percent above that of White Non-– Hispanic households. That gap has widened substantially and now Asian households have a median income 25 percent above White Non-– Hispanic households. The gap has increased because White Non-– Hispanic households have stagnated, rising four percent inflation adjusted terms between 2002 in 2016, while Asian incomes have increased 16 percent.
Hispanic median household income was $47,675, an increase of eight percent from 2002. African-American (alone) median household income was $39,490, up two percent ,an even lower increase than White Non-– Hispanic four percent from 2002 (Figure 1).


San Jose: America's Most Affluent Metropolitan Area for Households, https://en.wikipedia.org/wiki/San_Jose,_California#/media/File:AlumRockV... (Creative Commons)
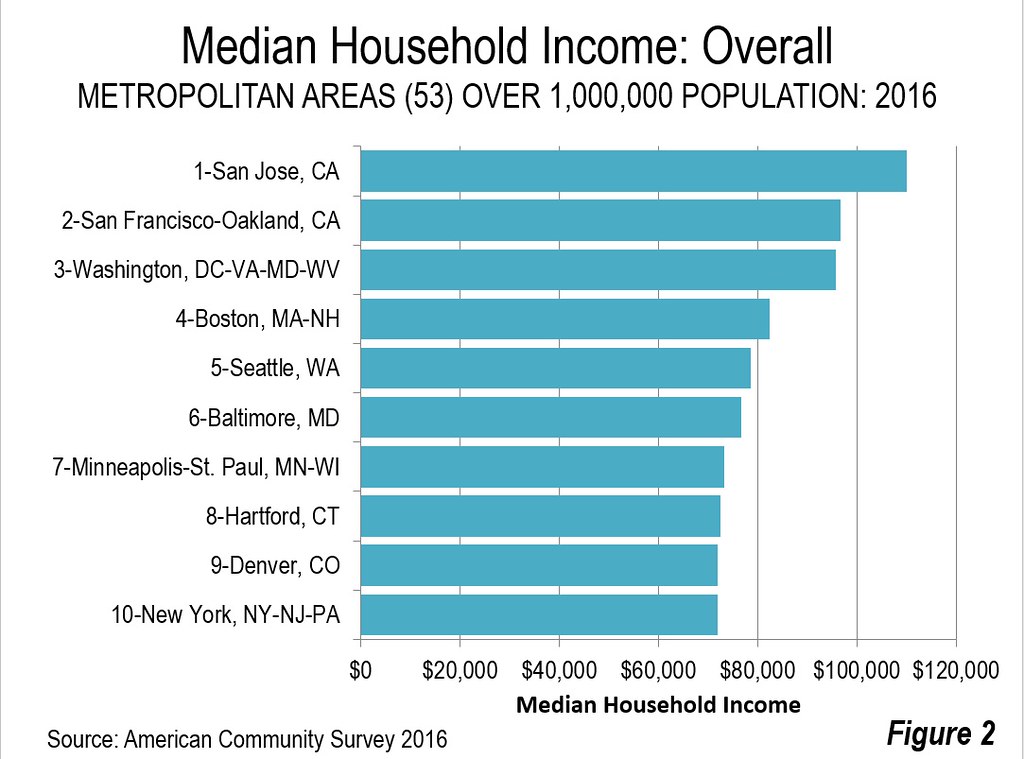
Highest and Lowest Household Metropolitan Area Incomes: Overall
The highest median household income is in San Jose (photo above), at $110,400 annually, according to the American Community Survey, 2016. San Jose also has the highest median household income for all four ethnicities. Nearby San Francisco has the second highest median household income, $96,700. Washington is third, at $95,800. Fourth ranked Boston is more than $10,000 lower, while fifth ranked Seattle is nearly $4,000 below Boston. However, each of these places have very high costs of living that can more than make up for their advantages relative to cities with lower incomes, lower costs of living and, in an environment of graduated income taxes, lower annual tax payments.
The balance of the top 10 includes Baltimore, Minneapolis-St. Paul, Hartford, Denver and New York (Figure 2).
Tucson had the lowest median household income, at $47,800. Six of the least affluent 10 major metropolitan areas were in the South, including New Orleans, Memphis, Tampa – St. Petersburg, Miami, Birmingham and Orlando. The East and Midwest each had one in the bottom 10, Cleveland and Buffalo. The West's Las Vegas was also in the least affluent 10.
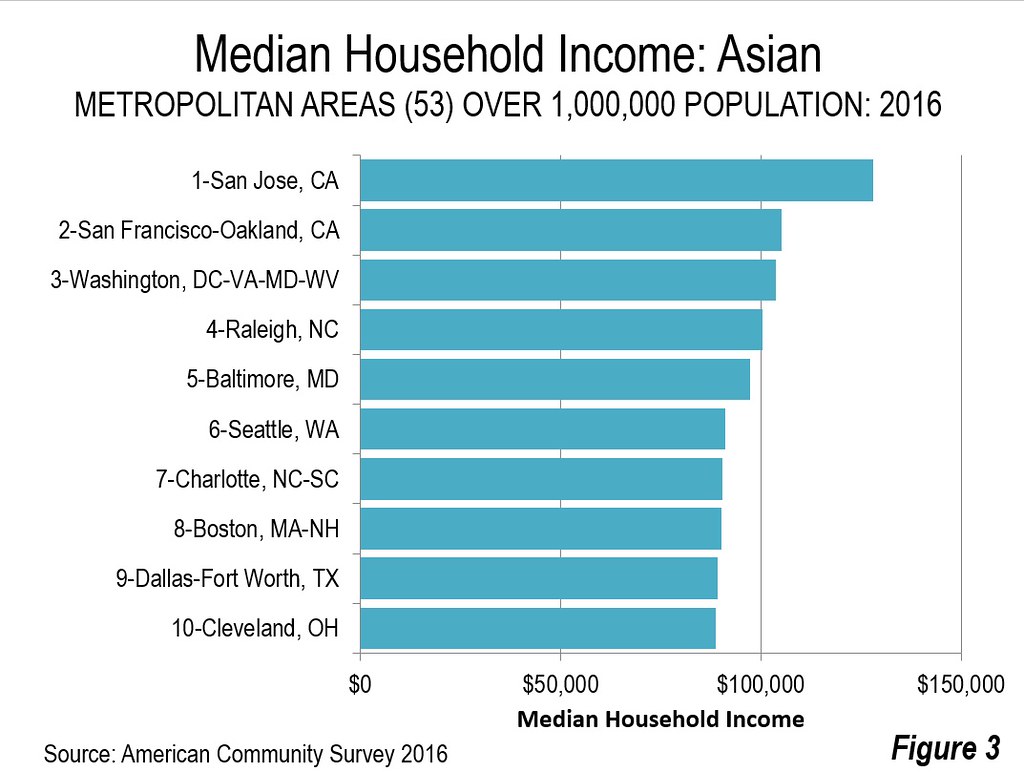
Asians Households: The Most Affluent
The three most affluent major metropolitan areas for Asian households duplicate the overall ratings, above, San Jose, San Francisco and Washington. Raleigh ranks fourth and Baltimore fifth, followed by Seattle, Charlotte, Boston, Dallas-Fort Worth and Cleveland (Figure 3).
Tucson also had the lowest Asian median household income, with Buffalo and New Orleans only slightly higher. Grand Rapids was the fourth least affluent followed by Rochester. Oklahoma City, Birmingham, Jacksonville, Indianapolis and Las Vegas rounded out the least 10 affluent Asian households.
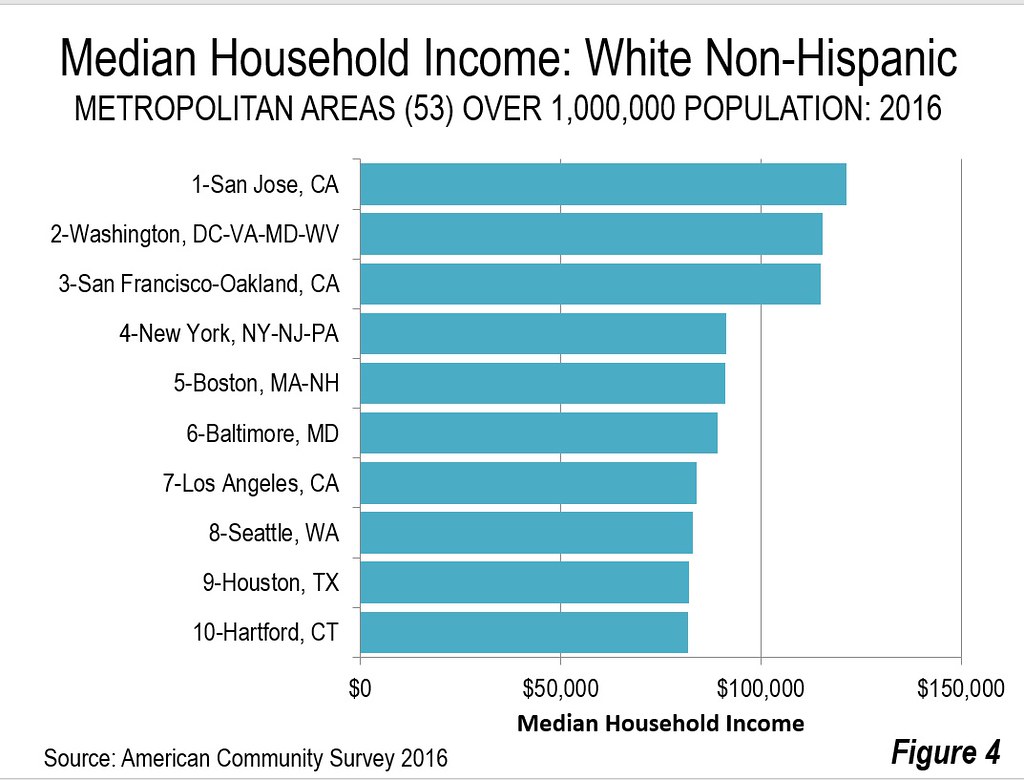
White Non-Hispanic Households
The top three among White Non-Hispanic households are the same as the overall and Asian rankings, though Washington is rated second, instead of third, with San Jose first and San Francisco third. New York was fourth, while Boston was fifth. The balance of the top ten for White Non-Hispanic median household incomes included Baltimore, Los Angeles, Seattle, Houston, and Hartford (Figure 4).
Tucson had the lowest White Non-– Hispanic median household income, at $53,700. Tampa St. Petersburg, Pittsburgh, Louisville and Buffalo made up the balance of the bottom five. Rochester, Cleveland, Oklahoma City, Birmingham and Las Vegas occupy positions six through 10.
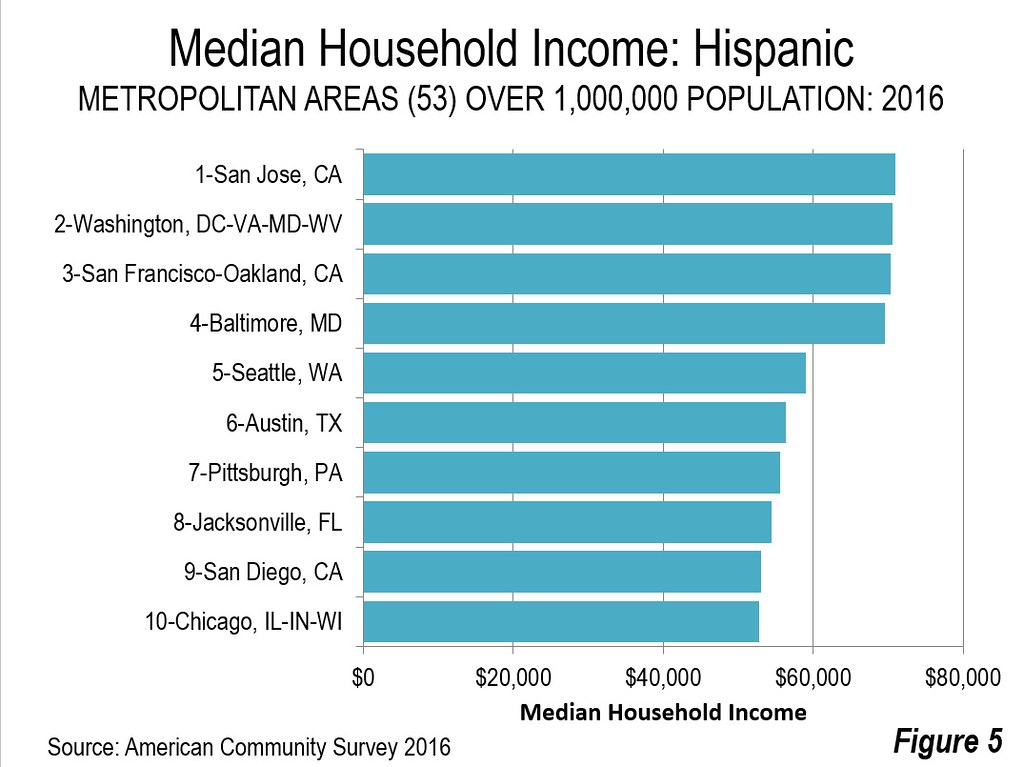
Hispanic Households
As with White Non-Hispanics, the highest Hispanic median household incomes were in San Jose, Washington and San Francisco. Baltimore and Seattle ranked fourth and fifth. The balance of the top 10 included Austin, Pittsburgh, Jacksonville, San Diego and Chicago (Figure 5)
Rochester had the least affluent Hispanic households, with a median income of $28,600. The balance of the bottom five included Buffalo, Indianapolis, Providence, and New Orleans. Milwaukee, Philadelphia, Tucson Louisville and Oklahoma City were also in the bottom 10.
African-American Households
The highest income African-American households were in San Jose, Baltimore and San Diego, followed by Denver and Austin. The fifth through 10th positions were occupied by New York, Raleigh, Boston, Atlanta, and Riverside-San Bernardino (Figure 6).

Buffalo had the lowest median household income among African – Americans, at $27,600. Milwaukee, New Orleans, Cleveland, and Rochester were also below 30,000. The sixth through 10th positions were occupied by Oklahoma City, Cincinnati, Pittsburgh, Indianapolis and Louisville, with incomes between $31,000 and $34,000.
The Challenge
The stagnation of incomes since 2002 is apparent, especially at the overall level and among African-American and White Non-Hispanic households. It is to be hoped that the future results in a return of historic economic growth, which is the only sure way of sustainably increasing the incomes of all households and all ethnicities.
Note: Because of differing data collection approaches, the Survey of Current Population (CPS) income data is somewhat higher (2.5 percent) than that of American Community Survey (ACS) 2016 figure of $57,617. CPS data is not available for most geographies. Because the principal, national and ethnicity analysis by the Census Bureau relies on CPS data, it is used here for the national level.
| Median Household Income: 2016: Metropolitan Areas over 1,000,000 Population | ||||||||||
| Metropolitan Area | All | Rank | White Non-Hispanic | Rank | African-American | Rank | Asian | Rank | Hispanic | Rank |
| Atlanta, GA | $ 62,613 | 22 | $ 75,435 | 19 | $ 48,161 | 10 | $ 80,209 | 22 | $ 50,563 | 21 |
| Austin, TX | $ 71,000 | 12 | $ 80,599 | 13 | $ 49,871 | 6 | $ 87,817 | 12 | $ 56,306 | 6 |
| Baltimore, MD | $ 76,788 | 6 | $ 89,329 | 6 | $ 53,231 | 3 | $ 97,252 | 5 | $ 69,525 | 4 |
| Birmingham, AL | $ 52,226 | 47 | $ 61,662 | 45 | $ 37,336 | 34 | $ 63,144 | 47 | $ 47,083 | 26 |
| Boston, MA-NH | $ 82,380 | 4 | $ 91,051 | 5 | $ 48,444 | 9 | $ 90,098 | 8 | $ 46,708 | 28 |
| Buffalo, NY | $ 53,487 | 45 | $ 60,342 | 49 | $ 27,635 | 52 | $ 45,726 | 52 | $ 28,939 | 52 |
| Charlotte, NC-SC | $ 59,979 | 31 | $ 67,742 | 28 | $ 42,108 | 22 | $ 90,291 | 7 | $ 43,680 | 36 |
| Chicago, IL-IN-WI | $ 66,020 | 16 | $ 79,865 | 15 | $ 37,258 | 35 | $ 87,469 | 13 | $ 52,730 | 10 |
| Cincinnati, OH-KY-IN | $ 60,260 | 28 | $ 65,438 | 34 | $ 32,429 | 46 | $ 86,953 | 14 | $ 50,932 | 20 |
| Cleveland, OH | $ 52,131 | 48 | $ 61,078 | 47 | $ 29,376 | 49 | $ 88,735 | 10 | $ 41,699 | 43 |
| Columbus, OH | $ 60,294 | 27 | $ 65,465 | 32 | $ 36,679 | 37 | $ 70,224 | 37 | $ 42,820 | 38 |
| Dallas-Fort Worth, TX | $ 63,812 | 20 | $ 78,994 | 17 | $ 45,588 | 18 | $ 89,177 | 9 | $ 48,311 | 24 |
| Denver, CO | $ 71,926 | 9 | $ 80,668 | 12 | $ 50,318 | 5 | $ 72,038 | 34 | $ 51,955 | 15 |
| Detroit, MI | $ 56,142 | 38 | $ 64,620 | 37 | $ 33,558 | 42 | $ 88,045 | 11 | $ 49,715 | 22 |
| Grand Rapids, MI | $ 60,212 | 29 | $ 63,872 | 40 | $ 34,667 | 41 | $ 54,819 | 50 | $ 41,997 | 41 |
| Hartford, CT | $ 72,559 | 8 | $ 81,839 | 10 | $ 47,328 | 13 | $ 83,141 | 18 | $ 42,200 | 40 |
| Houston, TX | $ 61,708 | 25 | $ 82,015 | 9 | $ 47,588 | 12 | $ 85,527 | 16 | $ 46,488 | 29 |
| Indianapolis. IN | $ 56,750 | 37 | $ 63,826 | 41 | $ 32,696 | 44 | $ 64,404 | 45 | $ 35,941 | 51 |
| Jacksonville, FL | $ 56,840 | 36 | $ 62,373 | 42 | $ 41,007 | 26 | $ 63,473 | 46 | $ 54,447 | 8 |
| Kansas City, MO-KS | $ 61,385 | 26 | $ 67,607 | 29 | $ 36,575 | 38 | $ 68,609 | 41 | $ 45,672 | 33 |
| Las Vegas, NV | $ 54,384 | 44 | $ 61,833 | 44 | $ 37,410 | 32 | $ 65,423 | 44 | $ 45,831 | 32 |
| Los Angeles, CA | $ 65,950 | 18 | $ 84,075 | 7 | $ 45,469 | 19 | $ 75,879 | 27 | $ 52,076 | 13 |
| Louisville, KY-IN | $ 54,546 | 43 | $ 60,235 | 50 | $ 33,287 | 43 | $ 65,867 | 43 | $ 41,628 | 45 |
| Memphis, TN-MS-AR | $ 49,809 | 51 | $ 67,781 | 27 | $ 35,542 | 39 | $ 72,892 | 33 | $ 42,244 | 39 |
| Miami, FL | $ 51,362 | 49 | $ 65,176 | 35 | $ 40,239 | 29 | $ 69,547 | 39 | $ 45,938 | 30 |
| Milwaukee,WI | $ 58,029 | 35 | $ 68,540 | 26 | $ 28,942 | 51 | $ 82,121 | 21 | $ 39,389 | 48 |
| Minneapolis-St. Paul, MN-WI | $ 73,231 | 7 | $ 78,864 | 18 | $ 34,720 | 40 | $ 73,010 | 32 | $ 51,122 | 18 |
| Nashville, TN | $ 60,030 | 30 | $ 65,441 | 33 | $ 41,374 | 25 | $ 71,900 | 35 | $ 44,503 | 34 |
| New Orleans. LA | $ 48,804 | 52 | $ 64,152 | 39 | $ 29,296 | 50 | $ 46,860 | 51 | $ 37,463 | 49 |
| New York, NY-NJ-PA | $ 71,897 | 10 | $ 91,454 | 4 | $ 49,488 | 7 | $ 83,063 | 19 | $ 47,266 | 25 |
| Oklahoma City, OK | $ 55,065 | 42 | $ 61,536 | 46 | $ 31,344 | 47 | $ 59,865 | 48 | $ 41,657 | 44 |
| Orlando, FL | $ 52,385 | 46 | $ 62,218 | 43 | $ 37,356 | 33 | $ 76,575 | 25 | $ 42,959 | 37 |
| Philadelphia, PA-NJ-DE-MD | $ 65,996 | 17 | $ 79,869 | 14 | $ 39,609 | 30 | $ 74,597 | 28 | $ 40,334 | 47 |
| Phoenix, AZ | $ 58,075 | 34 | $ 64,286 | 38 | $ 42,006 | 23 | $ 73,380 | 30 | $ 45,883 | 31 |
| Pittsburgh, PA | $ 56,063 | 40 | $ 59,046 | 51 | $ 32,534 | 45 | $ 76,005 | 26 | $ 55,641 | 7 |
| Portland, OR-WA | $ 68,676 | 14 | $ 71,859 | 23 | $ 37,452 | 31 | $ 79,128 | 23 | $ 52,507 | 11 |
| Providence, RI-MA | $ 61,948 | 23 | $ 66,853 | 30 | $ 41,401 | 24 | $ 85,568 | 15 | $ 36,639 | 50 |
| Raleigh, NC | $ 71,685 | 11 | $ 79,539 | 16 | $ 49,433 | 8 | $ 100,396 | 4 | $ 44,346 | 35 |
| Richmond, VA | $ 62,929 | 21 | $ 74,900 | 20 | $ 43,265 | 20 | $ 85,510 | 17 | $ 51,084 | 19 |
| Riverside-San Bernardino, CA | $ 58,236 | 33 | $ 64,699 | 36 | $ 47,879 | 11 | $ 77,682 | 24 | $ 51,892 | 16 |
| Rochester, NY | $ 55,134 | 41 | $ 60,441 | 48 | $ 29,527 | 48 | $ 58,907 | 49 | $ 28,553 | 53 |
| Sacramento, CA | $ 64,052 | 19 | $ 71,675 | 24 | $ 40,969 | 27 | $ 69,088 | 40 | $ 51,555 | 17 |
| St. Louis,, MO-IL | $ 59,780 | 32 | $ 66,815 | 31 | $ 36,712 | 36 | $ 68,112 | 42 | $ 52,005 | 14 |
| Salt Lake City, UT | $ 68,196 | 15 | $ 72,356 | 21 | $ 73,650 | 29 | $ 49,637 | 23 | ||
| San Antonio, TX | $ 56,105 | 39 | $ 72,280 | 22 | $ 46,754 | 15 | $ 71,485 | 36 | $ 46,943 | 27 |
| San Diego, CA | $ 70,824 | 13 | $ 81,431 | 11 | $ 52,715 | 4 | $ 82,136 | 20 | $ 53,076 | 9 |
| San Francisco-Oakland, CA | $ 96,677 | 2 | $ 115,056 | 3 | $ 46,571 | 16 | $ 105,295 | 2 | $ 70,290 | 3 |
| San Jose, CA | $ 110,040 | 1 | $ 121,344 | 1 | $ 65,438 | 2 | $ 128,175 | 1 | $ 70,999 | 1 |
| Seattle, WA | $ 78,612 | 5 | $ 82,935 | 8 | $ 47,270 | 14 | $ 91,036 | 6 | $ 59,073 | 5 |
| Tampa-St. Petersburg, FL | $ 51,115 | 50 | $ 54,295 | 52 | $ 40,760 | 28 | $ 69,574 | 38 | $ 41,767 | 42 |
| Tucson, AZ | $ 47,560 | 53 | $ 53,722 | 53 | $ 43,154 | 21 | $ 45,648 | 53 | $ 40,394 | 46 |
| Virginia Beach-Norfolk, VA-NC | $ 61,805 | 24 | $ 71,553 | 25 | $ 46,209 | 17 | $ 73,191 | 31 | $ 52,353 | 12 |
| Washington, DC-VA-MD-WV | $ 95,843 | 3 | $ 115,474 | 2 | $ 69,246 | 1 | $ 103,746 | 3 | $ 70,523 | 2 |
| Source: American Community Survey 2016 | ||||||||||
| Blank indicates insufficiently large sample size | ||||||||||
Wendell Cox is principal of Demographia, an international public policy and demographics firm. He is a Senior Fellow of the Center for Opportunity Urbanism (US), Senior Fellow for Housing Affordability and Municipal Policy for the Frontier Centre for Public Policy (Canada), and a member of the Board of Advisors of the Center for Demographics and Policy at Chapman University (California). He is co-author of the "Demographia International Housing Affordability Survey" and author of "Demographia World Urban Areas" and "War on the Dream: How Anti-Sprawl Policy Threatens the Quality of Life." He was appointed to three terms on the Los Angeles County Transportation Commission, where he served with the leading city and county leadership as the only non-elected member. He served as a visiting professor at the Conservatoire National des Arts et Metiers, a national university in Paris.


