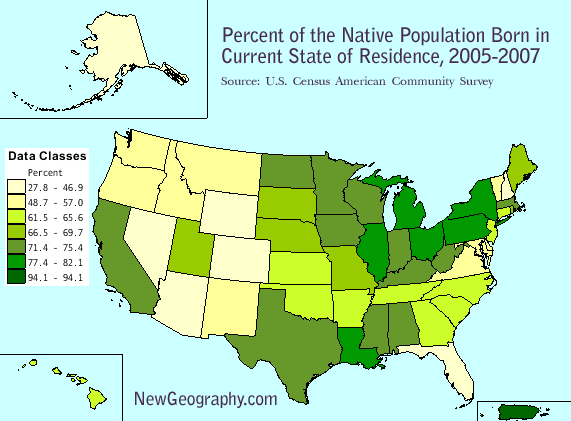
In which states do folks tend to stay home? Here's a look at Americans still living in their birth states. New York and Louisiana top the list. Upwards of 82% of the US-born residents living in New York and Louisiana were born there. Looking at the map, you can see that the highest numbers reside in the rust belt and northeast. The most transplants tend to live in natural amenity rich western states, except for California.
More than 72% of US born Californians were born in the state. That number is over 74% in LA county, but only about 60% in San Diego. Other high transplant areas include New Hampshire and Vermont in the northeast, and not surprisingly the Washington DC area, Florida, and Nevada.
Only 41.7% of US born Alaskans were born there. I suppose if you are living in Alaska, you've come there for good reason.
Take a look at an extension of this analysis: Does a low number of home staters mean everyone has left?

| Percent of Native Population Born in their Current State of Residence | ||
| Geographic area | Percent | Margin of Error |
| New York | 82.1 | +/-0.1 |
| Louisiana | 82 | +/-0.2 |
| Michigan | 80.6 | +/-0.1 |
| Pennsylvania | 79.6 | +/-0.1 |
| Ohio | 77.8 | +/-0.1 |
| Illinois | 77.4 | +/-0.1 |
| Iowa | 75.4 | +/-0.3 |
| Wisconsin | 75.3 | +/-0.2 |
| Massachusetts | 74.7 | +/-0.2 |
| Minnesota | 73.8 | +/-0.2 |
| Kentucky | 73.6 | +/-0.2 |
| Mississippi | 73.4 | +/-0.3 |
| Alabama | 73.2 | +/-0.3 |
| West Virginia | 72.9 | +/-0.3 |
| Texas | 72.3 | +/-0.1 |
| North Dakota | 72.1 | +/-0.4 |
| California | 71.8 | +/-0.1 |
| Indiana | 71.4 | +/-0.2 |
| Nebraska | 69.7 | +/-0.3 |
| Missouri | 68.9 | +/-0.2 |
| Utah | 68.5 | +/-0.3 |
| Rhode Island | 67.9 | +/-0.6 |
| South Dakota | 67.5 | +/-0.5 |
| United States | 67.3 | +/-0.1 |
| Maine | 66.5 | +/-0.5 |
| Hawaii | 65.6 | +/-0.5 |
| New Jersey | 65.4 | +/-0.2 |
| Tennessee | 65 | +/-0.2 |
| Oklahoma | 64.8 | +/-0.2 |
| North Carolina | 64.1 | +/-0.2 |
| Connecticut | 64 | +/-0.3 |
| Arkansas | 63.8 | +/-0.3 |
| South Carolina | 63.4 | +/-0.3 |
| Kansas | 62.7 | +/-0.3 |
| Georgia | 61.5 | +/-0.2 |
| New Mexico | 57 | +/-0.4 |
| Virginia | 56.3 | +/-0.2 |
| Montana | 55.3 | +/-0.5 |
| Maryland | 54.6 | +/-0.3 |
| Vermont | 54.5 | +/-0.5 |
| Washington | 53.7 | +/-0.2 |
| Oregon | 50.2 | +/-0.3 |
| Delaware | 50 | +/-0.6 |
| Idaho | 48.7 | +/-0.4 |
| Colorado | 46.9 | +/-0.3 |
| District of Columbia | 45.5 | +/-0.7 |
| New Hampshire | 44.4 | +/-0.4 |
| Wyoming | 43.3 | +/-0.8 |
| Alaska | 41.7 | +/-0.6 |
| Arizona | 41.7 | +/-0.3 |
| Florida | 41.4 | +/-0.1 |
| Nevada | 27.8 | +/-0.4 |
Source: U.S. Census Bureau, 2005-2007 American Community Survey


