
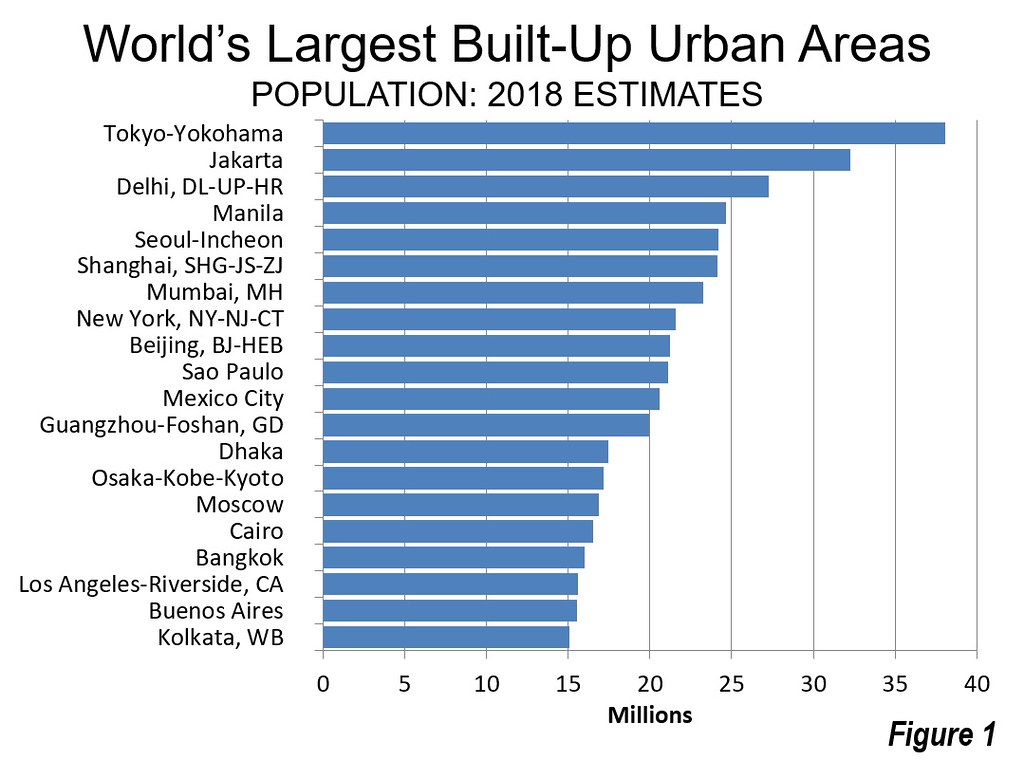
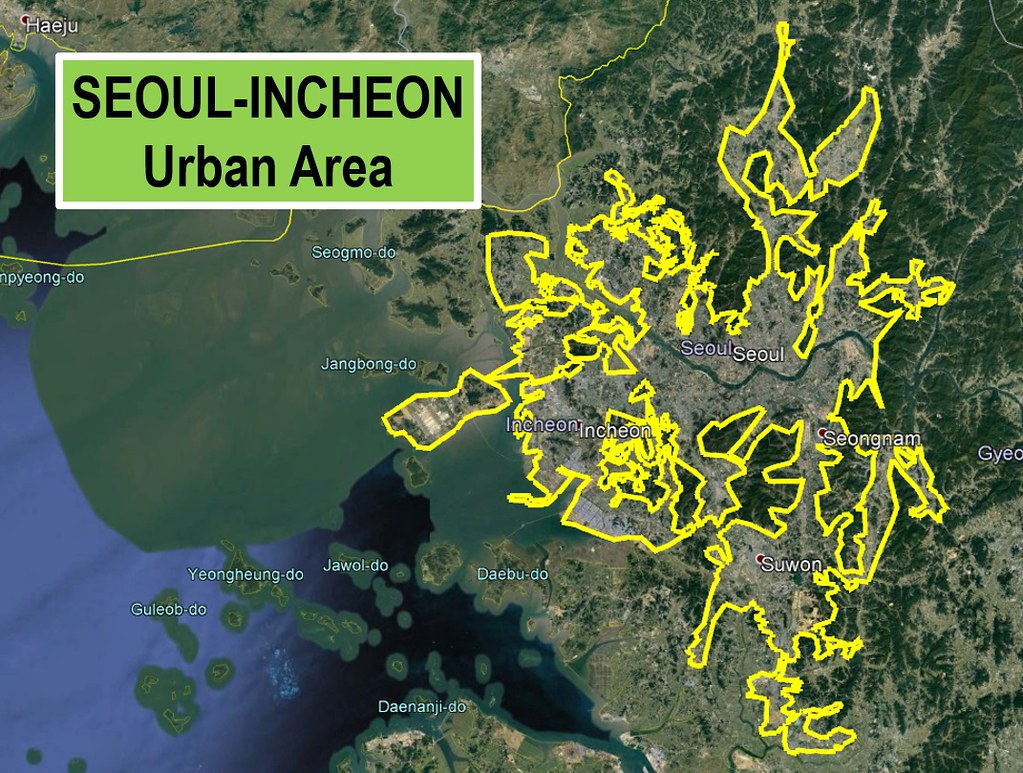
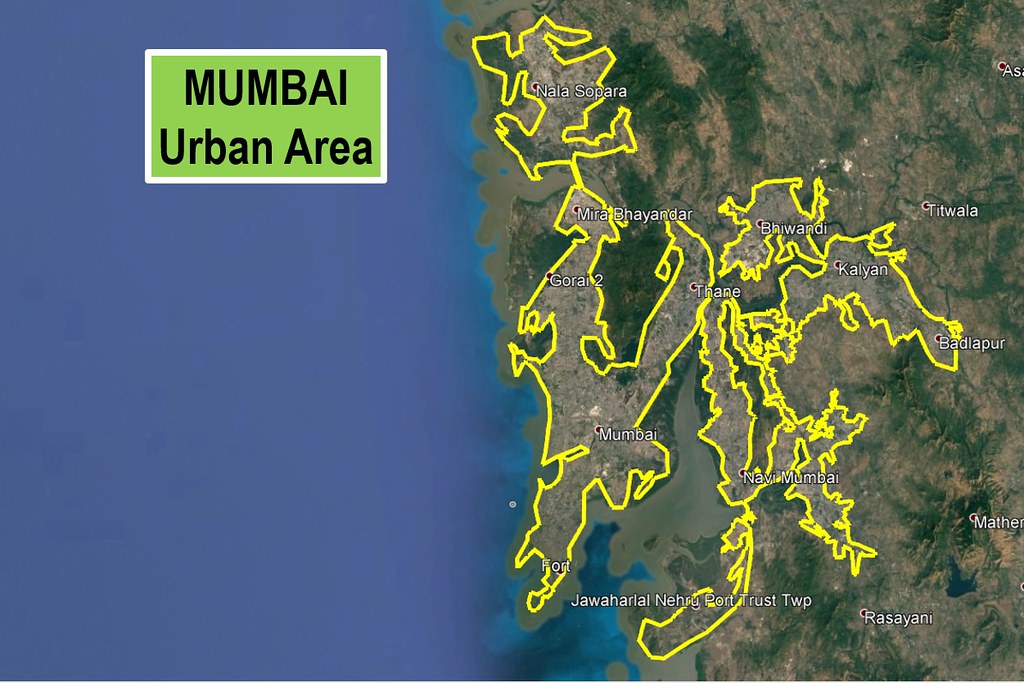
This year, as in 2017, there are 37 megacities --- urban areas estimated to have more than 10 million residents. The 20 largest urban areas are indicated in Figure 1. Tokyo-Yokohama continued to be the largest, as it has been for more than six decades. Second ranked Jakarta and third ranked Delhi continue to edge up on Tokyo-Yokohama. Even if their much faster growth were to continue at the current rate, neither would assume the top position over Tokyo-Yokohama until after 2030. The top five is rounded out by Manila and Seoul-Incheon (Figure 2). The balance of the top ten includes Shanghai, Mumbai (Figure 3), New York, Beijing and Sao Paulo.
The 14th Annual Demographia World Urban Areas contains data on the 1,064 urban areas that have been identified as having more than 500,000 residents in 2018 (Note: Estimating Urban Density). Table 2 in the report lists all of these urban areas in order by population. Table 1 is a world summary of urban density data.
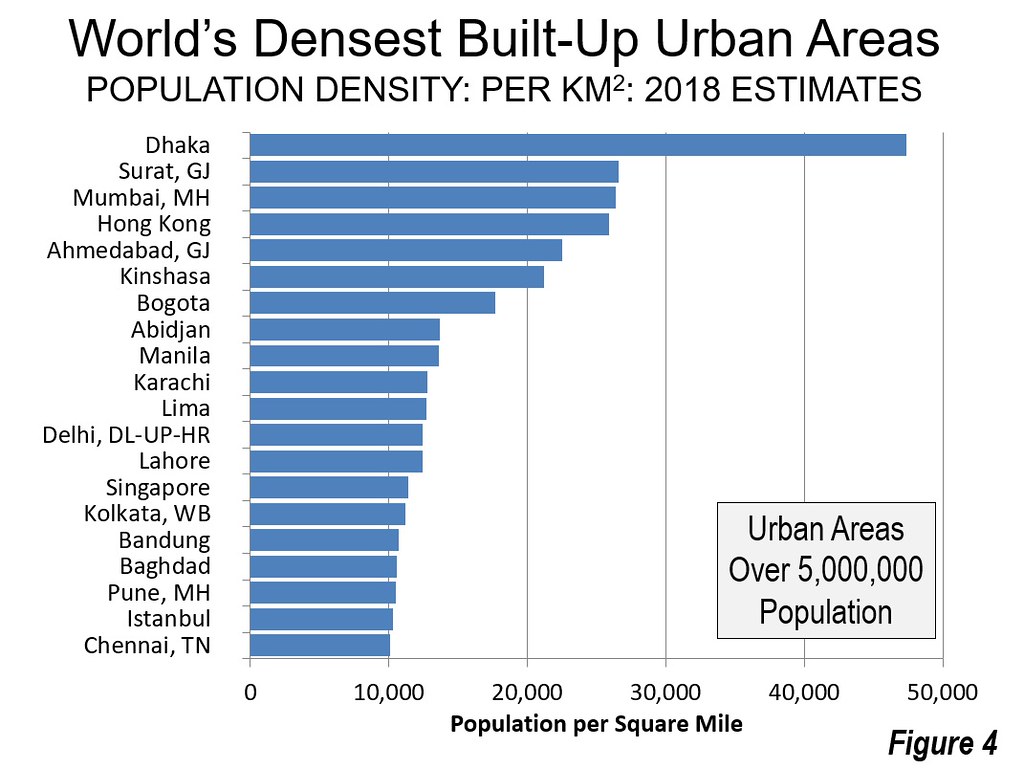
Table 4 in the report lists the 1,064 urban areas in descending order by urban density. The 20 densest urban areas with more than 5,000,000 population are shown in Figure 4 (below). Dhaka remains by far the highest density urban area, with 123,000 residents per square mile (47,000 per square kilometer). Dhaka’s urban area of 17.4 million residents ranks as the 13th largest in the world and stands among the fastest growing. With a land area only 368 square kilometers (142 square miles), the Dhaka urban area covers less land than the city (municipality) of New York, covers 97 percent less land than the New York urban area, is five times as dense as the city of New York, and 25 times as dense as the New York urban area.
The second densest large urban area is Surat (Gujurat), India, at 69,000 residents per square mile (27,000 per square kilometer). Four other large urban areas exceed 20,000 per square kilometer; India’s Mumbai, Hong Kong, Ahmadabad (Gujarat), India and Kinshasa, in the Democratic Republic of the Congo. The 20 densest large urban areas include only two in the high-income world, Hong Kong and Singapore. Both have artificially high densities because geo-political factors have made development of suburbs virtually impossible.
World Urban Population and Median Urban Area
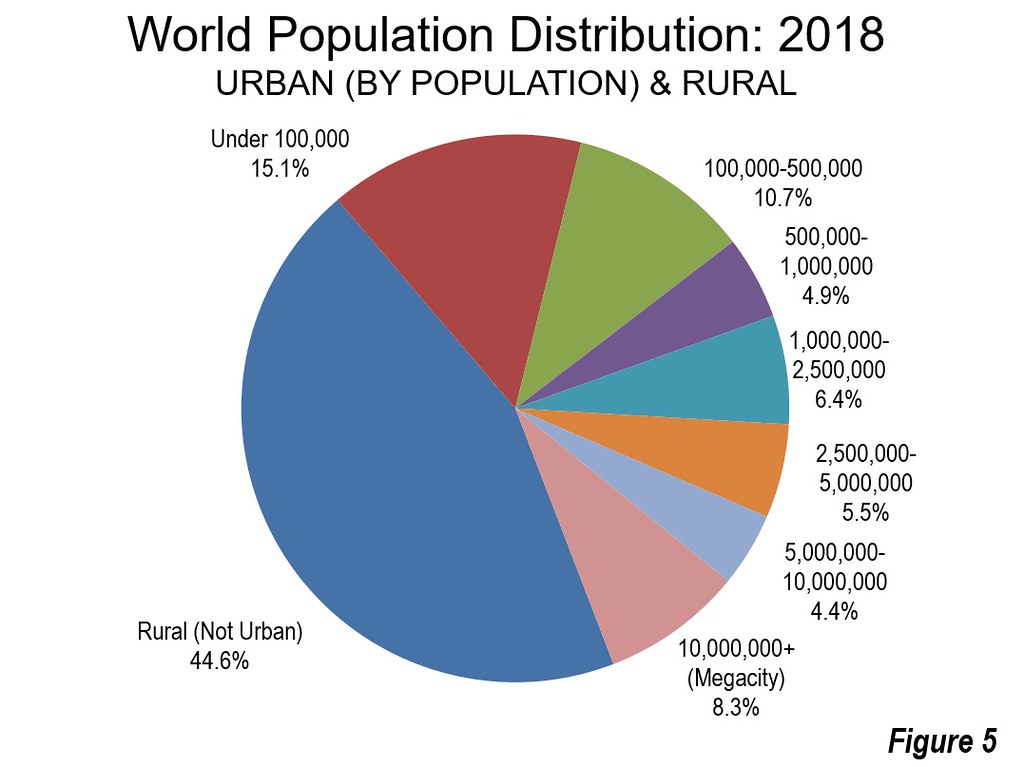
As has been widely reported in recent years, more of the world’s people live in urban areas than in rural areas for the first time in history. The urban population has risen to 55.4 percent, according to the United Nations. This does not mean, however, that most people live in megacities or even the largest cities.
Based on the current population estimates, it is estimated that the median sized urban area has approximately 645,000 residents, the size of either Tyumen (Ural District), Russia or Cape Coral (Florida), United States. These urban areas are tied for 831st largest in the word.
More than 70 percent of the world’s urban population lives in urban areas with less than 500,000 population and in rural areas. The megacities, those with more than 10 million population, have 8.3 percent of the population (Figure 5).
World Urban Areas Aggregate Population Densities
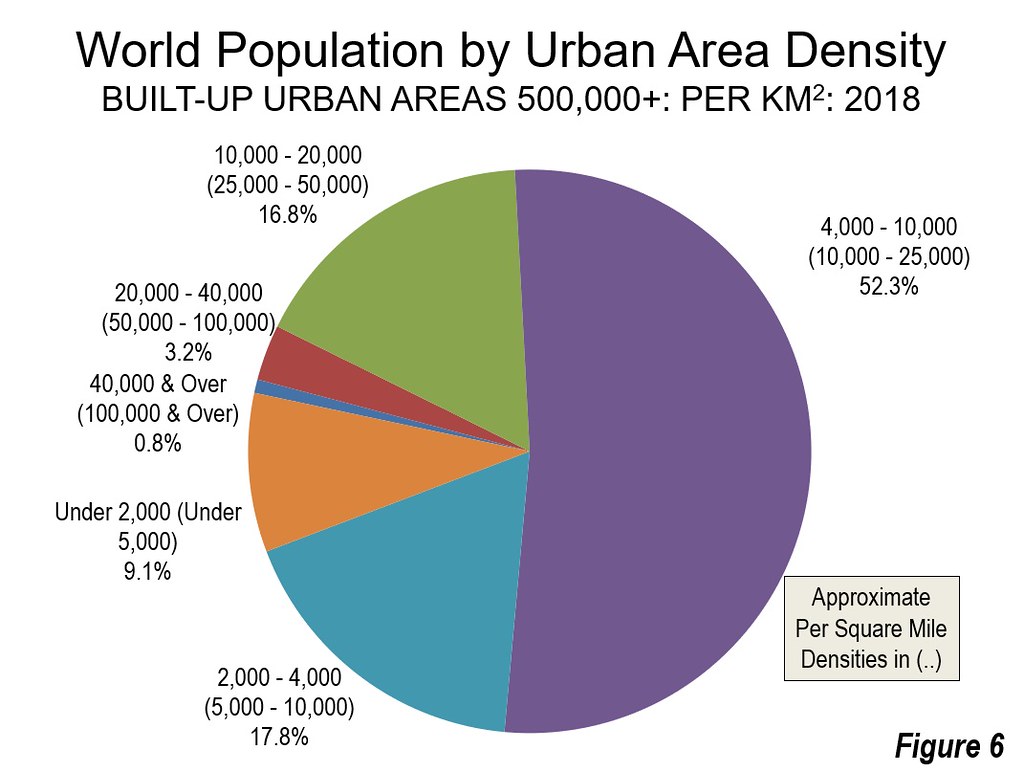
Much of the population (52.3 percent) in the 1,064 urban areas over 500,000 population lives at densities between 10,000 and 25,000 per square mile (4,000 and 10,000 per square kilometer). Approximately one-quarter lives at higher densities, and one-quarter at lower densities (Figure 5). Few high-income urban areas will be found in higher density categories.
Geographical Distribution of the Largest Urban Areas
As the world has become increasingly more urban, more of the largest urban areas are outside Western Europe, Canada, the United States and Japan, which had the largest affluent cities in the world in the second half of the 20th century. The United Nations publishes historical lists of the 30 largest urban areas in the world, starting with 1950 and in five year increments following that. In 1950, these nations contained 16 of the 30 largest urban areas in the world, according to the United Nations. London was ranked 3rd, and Paris ranked 5th. Osaka-Kobe Kyoto, then ranked 4th. Others that have fallen from the top 30 include Chicago, Philadelphia, Detroit, Boston, San Francisco, Rome, Milan, Barcelona, Berlin and Manchester.
In 1950, the United States had seven of the 30 largest urban areas in 1950; by 2018 that number has fallen to two.
Globally, urbanization continues apace, with the United Nations projecting that by 2050 66 percent of the world’s population will be urban. By current trends, few or perhaps no urban area from Western Europe, the United States, or Japan will break into the top 30. The modest growth rates in New York and Los Angeles could take these out of the top 30 as well.
Note: Estimating Urban Density
Demographia World Urban Areas is in its 14th year of publication. It was established for the purpose of bringing some consistency to the subject of urban density, in hopes of replacing often grossly invalid anecdotal comparisons between cities. The built-up urban area is the only level at which there is sufficiency consistency and sufficient data to estimate the urban densities of the urban organism at anything approximating international standards.
Demographia World Urban Areas uses base population figures, derived from official census and estimates data, to develop basic year population estimates within the confines of built-up urban areas. These figures are then adjusted to account for population change forecasts, principally from the United Nations or the various national statistics bureaus for a 2018 estimate.
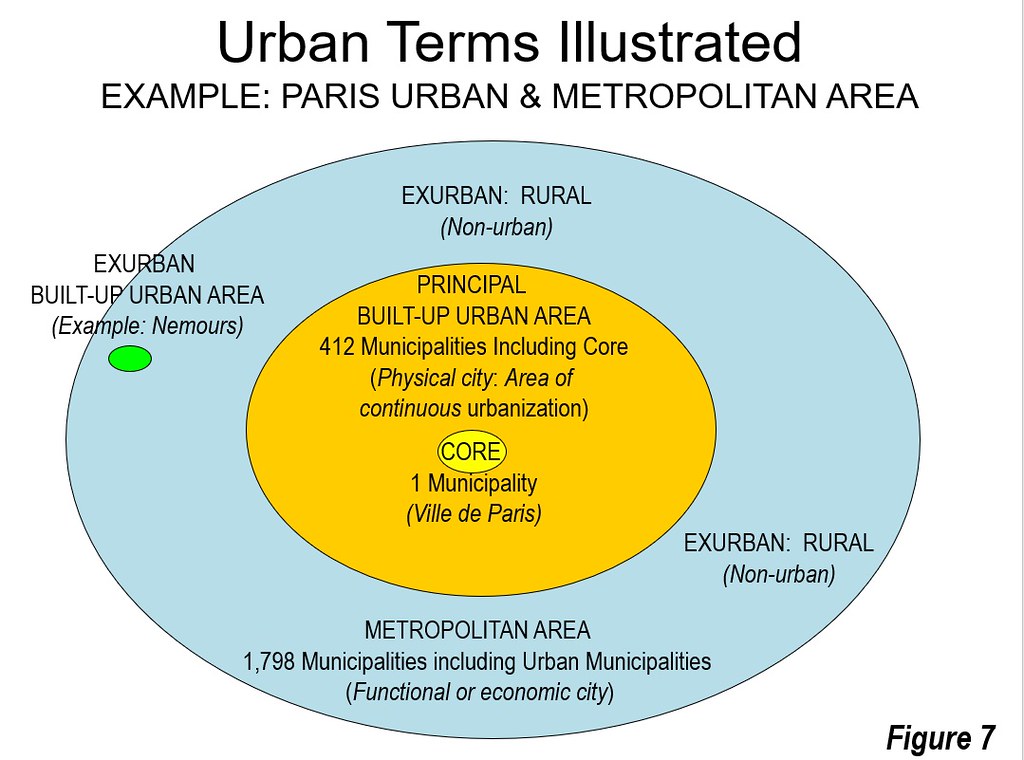
There continues to be considerable confusion about the measurement of urban densities. The key is in comprehending the differences between urban areas and metropolitan areas. Built-up urban areas are continuously built-up development that excludes rural lands. Built-up urban areas are the city in its physical form, as opposed to metropolitan areas, which are the economic or functional cities (the labor and housing markets). These terms are defined by Cheshire, et al. of the London School of Economics (see: “People rather than places, ends rather than means: LSE economists on urban containment”).
The built-up urban area is the only level at which there is sufficient data to estimate the densities of the urban organism (see: “Density is not the issue: The Urban Scaling Research”) at anything approximating international standards. Even with this data, the science of urban area density is in its infancy. Demographia’s principal aim has been to advance the state of urban density comparisons. Academics and the press have all too often been led by faulty data into comparisons in which (1) data that includes huge rural areas and is therefore not urban (2) includes only parts of urban areas that are not at all representative of the urban form (the urban organism). An example of the first is metropolitan areas, which by definition include rural areas and cannot possibly be reflective of urban density, such as in the United States. The second is illustrated by the ville de Paris, which is only a small part of the Paris urban area (Figure 7).
Demographia World Urban Areas was the first source to identify the under-estimation of population in some of the world’s largest urban areas, due to the significant under-estimation of urban land area by other sources. For example, Demographia’s early estimates of the Jakarta, Delhi, Manila, Seoul-Incheon and Kuala Lumpur urban area populations were far higher than reported by others at the time. Other sources have revised their estimates upward. The earlier, lower estimates of others were, in actuality, municipal estimates that did not sufficiently take into consideration the spread of urbanization beyond city or other geographical limits. Demographia’s larger population estimates were the result of examining actual satellite maps to determine the extent of individual built_up urban areas. As has been noted elsewhere, the improving satellite maps have permitted greater accuracy in later years. Similarly, in many cases, Demographia’s estimates have been lower than reported elsewhere for the opposite reason --- satellite examination has often shown other urban area estimates to include rural areas, which are by definition not urban.
Wendell Cox is principal of Demographia, an international public policy and demographics firm. He is a Senior Fellow of the Center for Opportunity Urbanism (US), Senior Fellow for Housing Affordability and Municipal Policy for the Frontier Centre for Public Policy (Canada), and a member of the Board of Advisors of the Center for Demographics and Policy at Chapman University (California). He is co-author of the "Demographia International Housing Affordability Survey" and author of "Demographia World Urban Areas" and "War on the Dream: How Anti-Sprawl Policy Threatens the Quality of Life." He was appointed to three terms on the Los Angeles County Transportation Commission, where he served with the leading city and county leadership as the only non-elected member. He served as a visiting professor at the Conservatoire National des Arts et Metiers, a national university in Paris.
Photograph: Cover from the 14th Annual Demographia World Urban Areas.


