
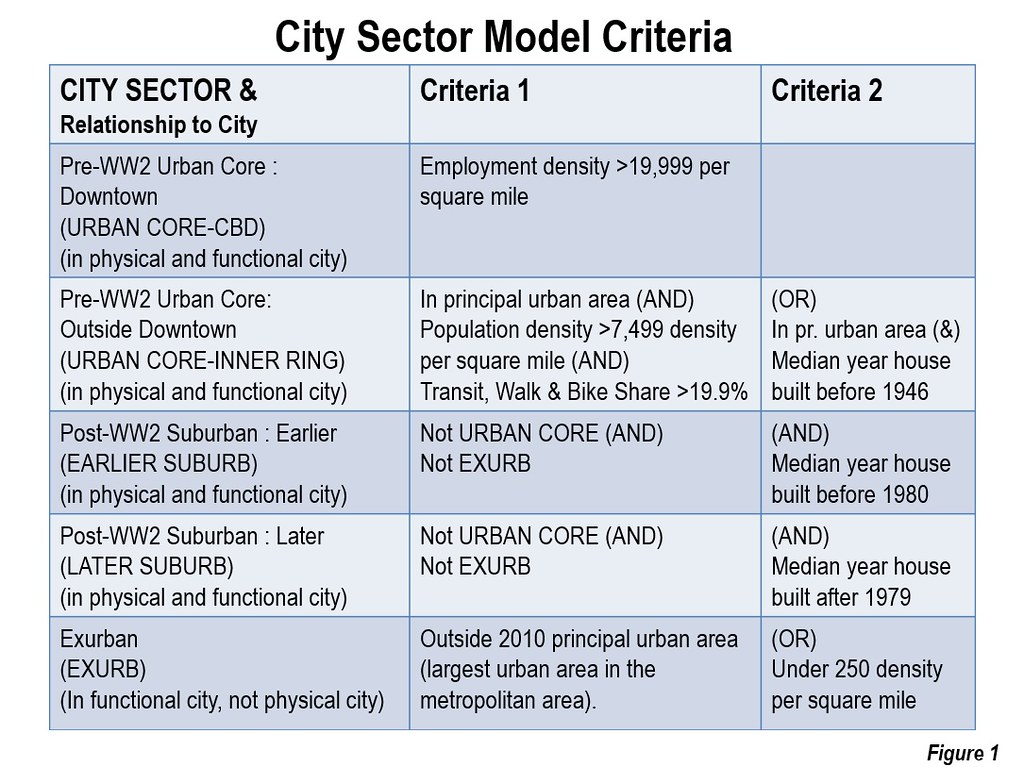
Since 2014, the City Sector Model has been used to portray population trends by functional area within the 53 major metropolitan areas (major metropolitan areas). The current edition classifies small areas (zip code tabulation areas) by demographic factors into five categories (Figure 1). The first two are urban core (central business district and inner ring), while the last three are suburban or exurban. The suburban areas are largely within the continuous built-up urban areas, while the exurban areas are generally in the metropolitan areas, but outside the built-up urban areas.
The advantage of this type of analysis permits much finer grained analysis of the urban form, principally splitting between areas similar to pre-World War II urbanization (urban core) and principally suburban (and exurban) areas that have developed since the war. The urban cores are denser and have lower levels of automobile use. The suburban and exurban areas are less dense and more automobile oriented.
Previous urban core versus suburban and exurban analysis relied principally on municipal boundaries, and assumed the urban core to be defined by one or more central municipalities. However, such analysis classifies large suburban areas, such as most of New York City's Staten Island as urban core, while classifying large, dense, transit oriented areas adjacent to the city of New York, especially in New Jersey, and inner suburbs of Boston as suburban. Some central cities, such as Phoenix and San Jose are nearly all suburban in form.
This article describes expansion of the City Sector Model to include the 52 additional middle-sized metropolitan areas, those with from 500,000 to 1,000,000 population in 2014 (the middle year of the 2012-2016 small area data used).
Middle-Sized and Major Metropolitan Areas
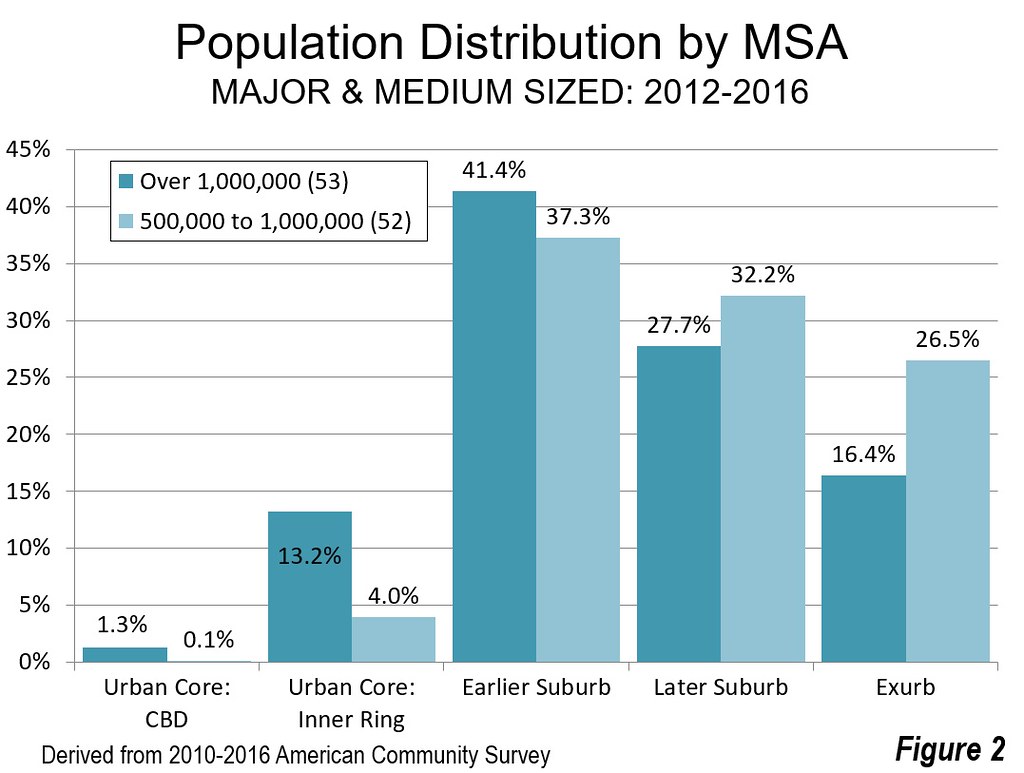
As previously reported, the 53 largest metropolitan areas had 14.5 percent of their population in the urban cores, according to data from the American Community Survey for 2012-2016 (See Note). 85.5 percent of major metropolitan area residents lived in suburban and exurban areas.
The middle-sized metropolitan areas are even more dispersed, with considerably lower urban core population shares than the major metropolitan areas. In 2012-2016, the middle-sized metropolitan areas had 4.1 percent of their population in urban cores, less than one-third that of the major metropolitan areas, leaving them 95.9 percent suburban and exurban. Among the non-urban core classifications, the largest contrast was in the exurban areas, where 28.1 percent of the middle-sized metropolitan area residents lived, about three-quarters above the 16.4 percent share for the major metropolitan areas (Figure 2).
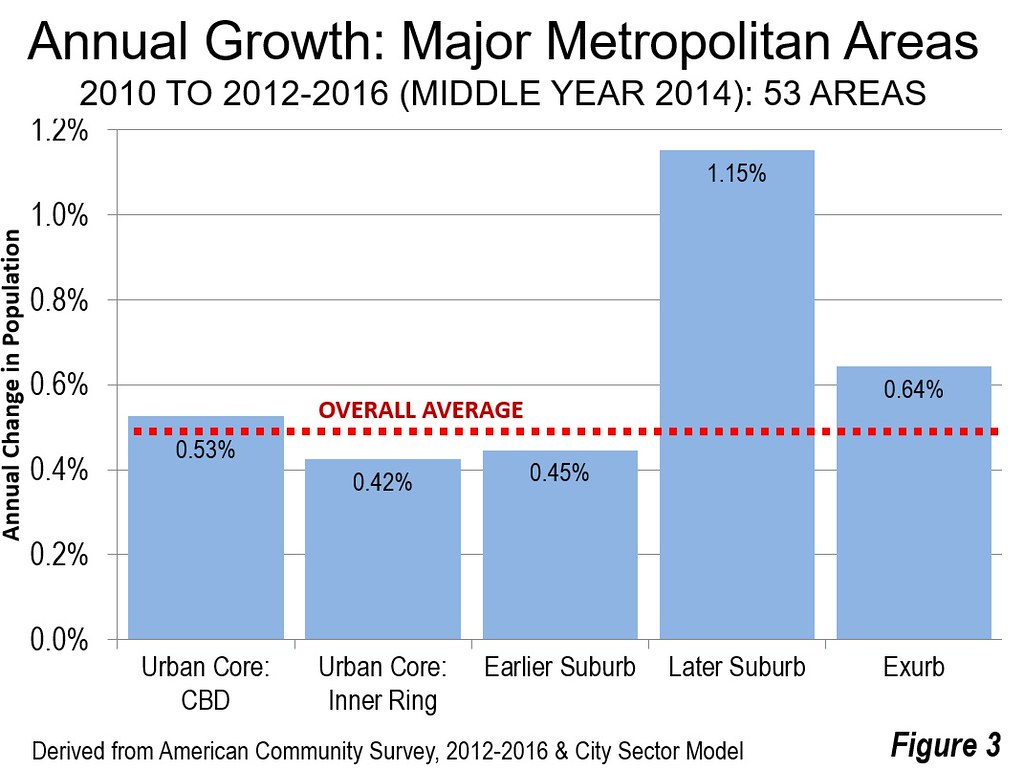
The population growth rates by sector were similar in the two categories of MSAs between 2010 and 2012-2016. Among the major metropolitan areas, the newer suburbs had the strongest annual growth rate. The exurban growth rate was the second strongest, followed closely by the Urban Core: Central Business District (Figure 3) although this sector has by far the smallest share of the population.
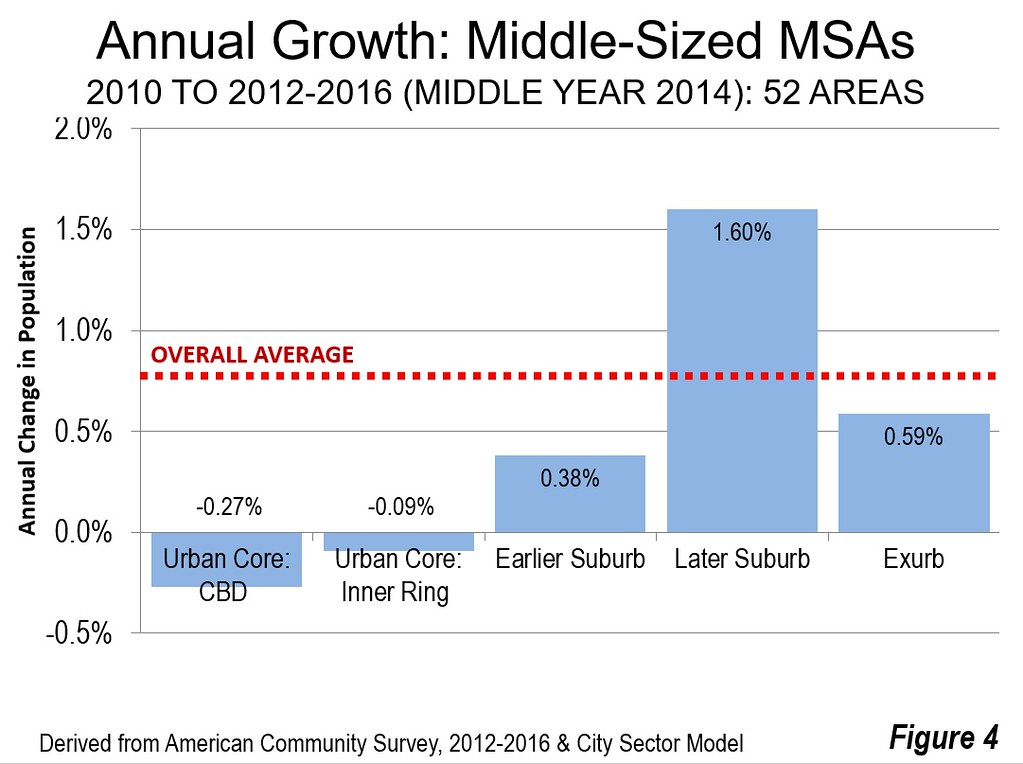
Similarly, the newer suburbs had the strongest growth rate in the middle-sized metropolitan areas, while the exurbs grew second fastest. Both urban core sectors dropped in population (Figure 4).
Comparative Strength of Urban Cores
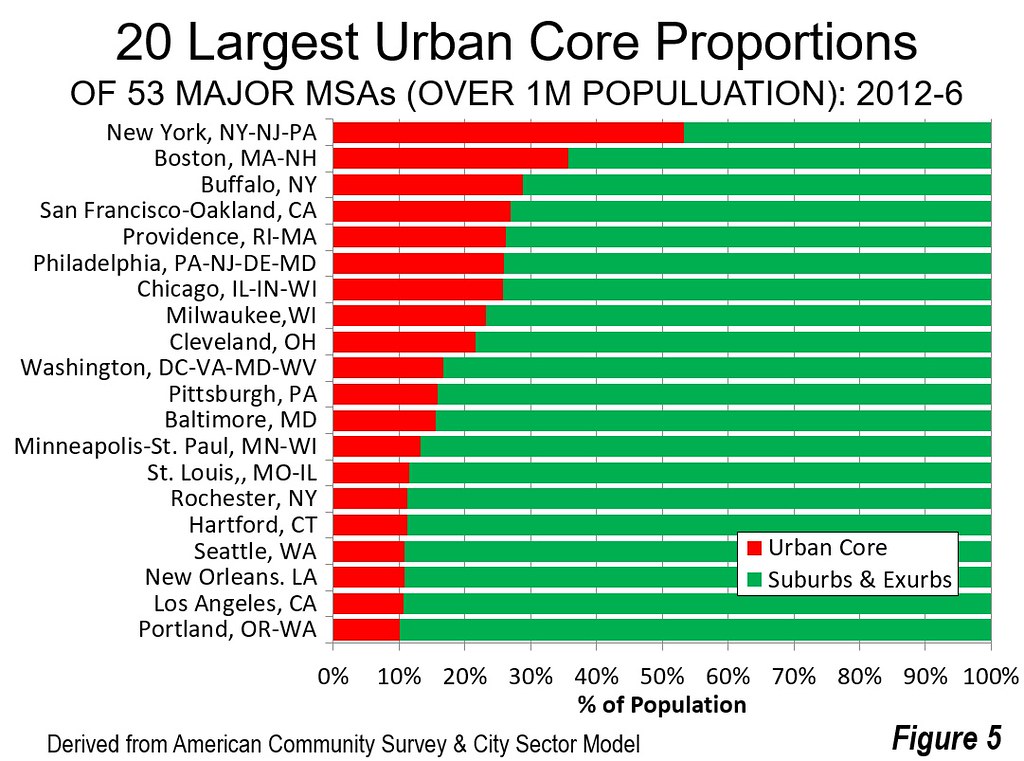
A number of major metropolitan areas have comparatively strong urban cores, led by New York, where the urban core accounts for more 53.3 percent of the population. Boston’s urban core has 35.6 percent of its metropolitan area population, while Buffalo, San Francisco, Providence, Philadelphia, Chicago, Milwaukee and Cleveland have urban cores with more than 20 percent of the metropolitan population (Figure 5). However, eight major metropolitan areas ---all in the south and west --- have virtually no urban core (with pre-war urban form characteristics).
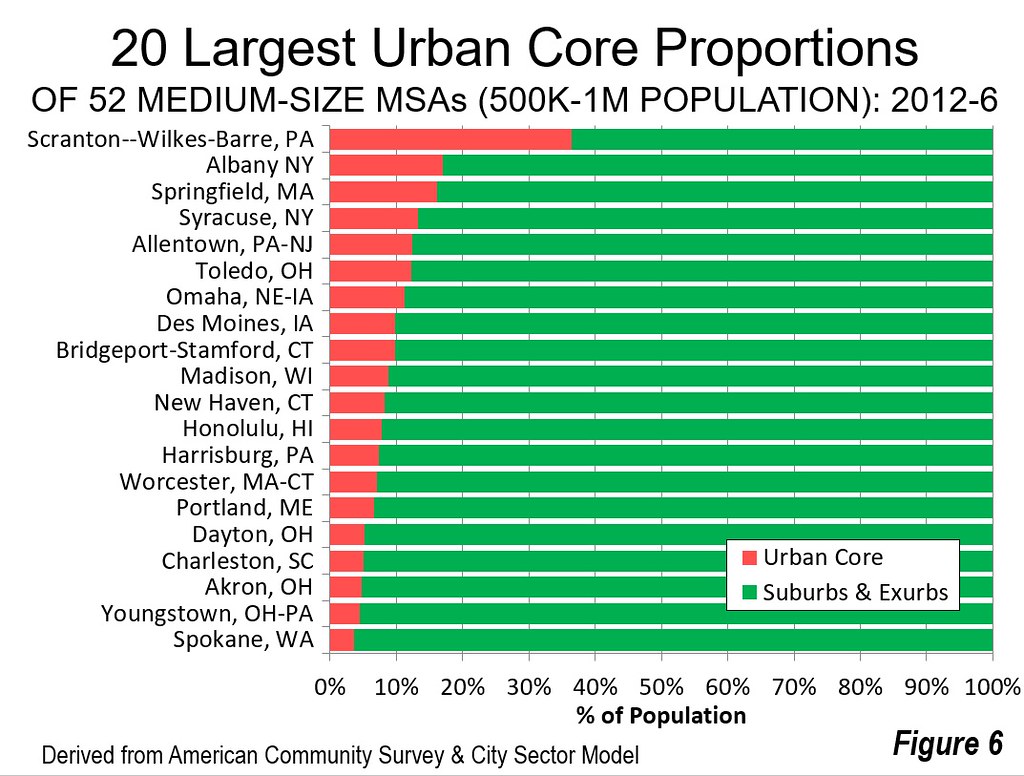
The urban cores are much smaller in the middle-sized metropolitan areas. However, the strongest urban core, in Scranton--Wilkes-Barre, Pennsylvania is second only to New York, at 36.5 percent, ahead of even Boston (Figure 6). Scranton--Wilkes-Barre is an extraordinary story, having missed out on the suburban led prosperity experienced just about everywhere else in the United States. In 1910, Scranton--Wilkes-Barre ranked 18th in population among today’s metropolitan areas (present geographical delineation); in 1930, Scranton--Wilkes-Barre led Seattle in population. Yet, since that time, Scranton--Wilkes-Barre has experienced substantial economic reverses, the victim of declining coal production in the Wyoming Valley (also called the “Anthracite Valley”). In 1930, at its peak, Scranton--Wilkes-Barre had a population of 770,000, which by 2017 had fallen to 555,000. This 28 percent population loss was far greater than that of any other of the 107 metropolitan areas with more than 500,000 population. Only one other metropolitan area lost population, Pittsburgh (2 percent). Among the other metropolitan areas, all gained population, with the slowest growth in Youngstown (18 percent). Other rust belt metropolitan areas experienced larger gains, such as Buffalo (25 percent), Akron (82 percent) and Detroit (88 percent). The average metropolitan area population increase from 1930 to 2017 was 230 percent. However, Scranton--Wilkes-Barre may be in for a revival, located just beyond the expanding commuting shed of New York.
Albany and Springfield, MA have urban cores above 15 percent, while Syracuse, Allentown, Toledo, Omaha, Des Moines and Bridgeport-Stamford have urban cores with 10 percent or more of their population. Seventeen middle-sized metropolitan areas have virtually no urban core. Combined, the 105 metropolitan areas with more than 500,000 population are 12.7 percent urban core and 87.3 percent suburban and exurban.
The United States: Little Urban Core
Little of America is urban core, even in the major and middle-sized metropolitan areas. Despite the impression often portrayed by the New York based national media, the dense urban cores have just a small fraction of the nation’s population. This applies not just to most big cities but most in the second ranks as well.
Note: American Community Survey (ACS) Five Year data
The ACS 5-year sample is collected over five years, in approximately weighted annual samples, from the first through the last year. It includes two general types of data, (1) demographic and (2) financial, which is inflation adjusted to the last year of the survey. Sometimes ACS 5-year data is characterized as relating to a specific year. This is incorrect, because the survey requires five years to complete. Its results reflect similar sized samples from each year. For example, the latest survey, 2012-2016 (used in this article) contains data from 2012, 2013, 2014, 2015 and 2016. The middle-year (in this case 2014) is probably most representative, but may be preferable to characterize the data as the range specified in the survey (2012-2016).
Wendell Cox is principal of Demographia, an international public policy and demographics firm. He is a Senior Fellow of the Center for Opportunity Urbanism (US), Senior Fellow for Housing Affordability and Municipal Policy for the Frontier Centre for Public Policy (Canada), and a member of the Board of Advisors of the Center for Demographics and Policy at Chapman University (California). He is co-author of the "Demographia International Housing Affordability Survey" and author of "Demographia World Urban Areas" and "War on the Dream: How Anti-Sprawl Policy Threatens the Quality of Life." He was appointed to three terms on the Los Angeles County Transportation Commission, where he served with the leading city and county leadership as the only non-elected member. He served as a visiting professor at the Conservatoire National des Arts et Metiers, a national university in Paris.
Photograph: Lackawanna County Courthouse, Scranton, PA in the Scranton--Wilkes-Barre metropolitan area, which has the strongest urban core of any middle-sized metropolitan area in the US. Source: https://commons.wikimedia.org/wiki/File:Lackawanna_County_Courthouse_008... (Wikipedia Commons).


