
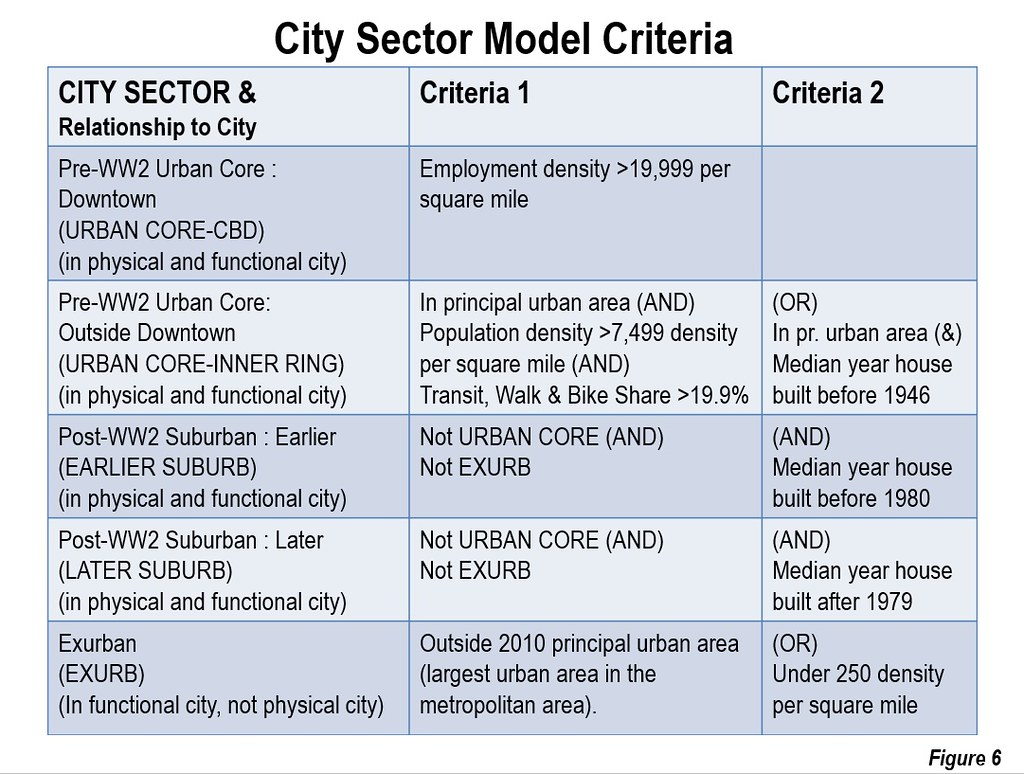
In recent years we have been using the City Sector Model (Figure 6, see City Sector Model Note below) to analyze the extent of urban core, suburban and exurban trends in major metropolitan areas. The City Sector Model gives a more accurate picture of how much modern metropolitan areas are dominated by the automobile oriented suburbanization that has occurred since World War II.
Before 1920, non-automobile modes of travel were far more important and during the War transit reached its ridership peak. The following period from 1920 to 1940 was transitional, as automobiles first achieved a significant presence across most US urban areas. These trends were strongest in the prosperous 1920s, but were somewhat interrupted by the Great Depression (late 1929 to 1939) and World War II (1941 to 1945). Automobile use rebounded after the War, expanding strongly.
The City Sector Model provides a much finer grain of suburban versus urban core analysis than possible from the previous analytical process relying on municipal jurisdictional boundaries (due to the lack of readily accessible smaller area data). A neighborhood in a central city may be anything from urban core to suburban, and even exurban. For example, much of the central city of Phoenix is automobile oriented suburban, as is most of San Jose and functionally suburban areas exists in many other central cities. Even the nation’s largest and densest large municipality, New York, has areas of automobile oriented suburbanization in southern Staten Island. The central cities of Oklahoma City and Kansas City include some exurban areas (outside the Census Bureau defined urban area).
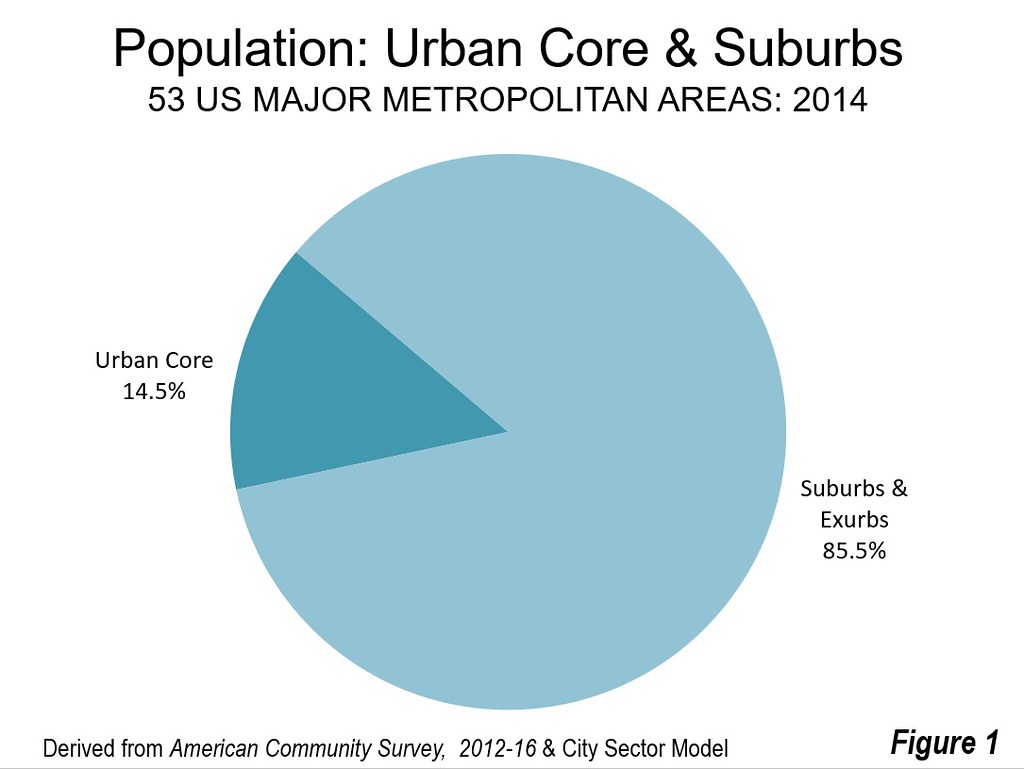
The latest estimates from the American Community Survey 2012-2016 (average year 2014) indicate that approximately 14.5 percent of the major metropolitan area population (the 53 with more than 1 million population) lives in the urban core. The rest, 85.5 percent, live in the suburbs and exurbs (Figure 1).
The very small percentage of people living in the urban core may have came as a surprise, since jurisdictional analyses had produced numbers as high as one-third. However, the City Sector Model urban core definition was conservative, with a minimum population density of 7,500 per square mile (2,900 per square kilometer) and a combined transit, walk and bicycle work trip market share of 20 percent or more. This population density threshold is far below the targets set in planning blueprints for substantial intensification, such as Plan Bay Area in the San Francisco area.
Where the Housing has been built
Housing development trends starting in 1950, using the construction dates of occupied housing, both owned and rented, from the American Community Survey, 2012-2016, reinforce the suburbanization thesis. The metropolitan area borders used are the present delineations. The post-war suburban boom started before 1950, though census data is not readily available for the period in the 1940s after the war. However, by 1947, the Levitts were building the first modern suburban housing tracts in Levittown (Long Island), New York, and millions of new comparatively inexpensive suburban houses were to follow across the country, including similar Levitt developments in New Jersey, Pennsylvania and Maryland.
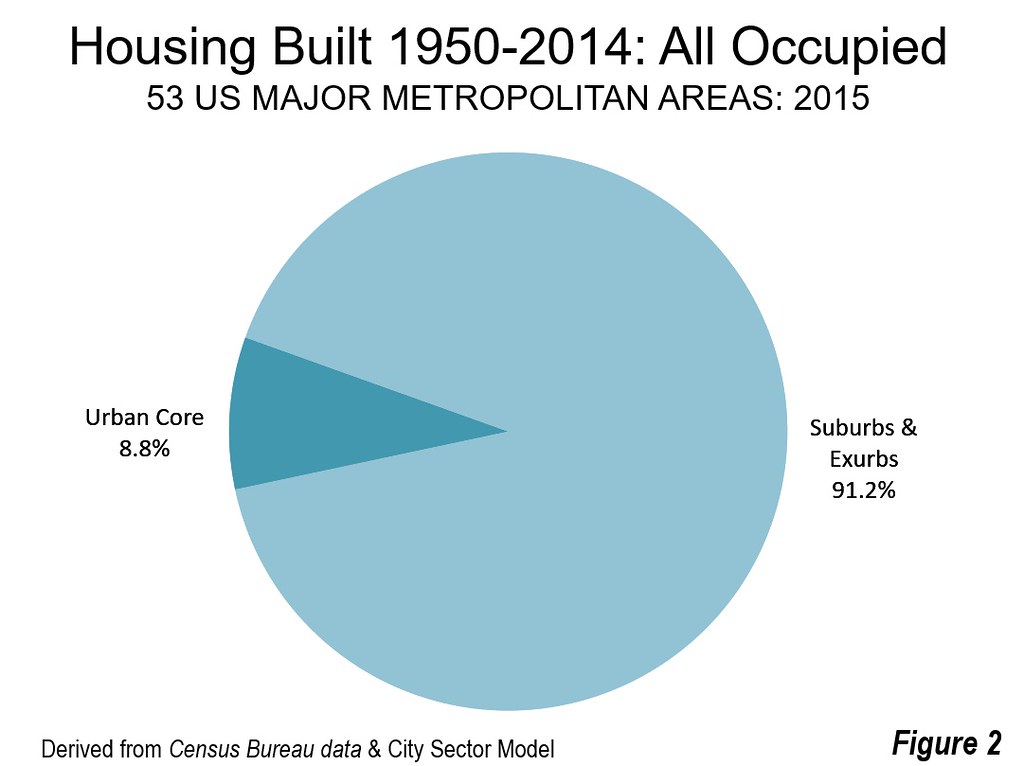
More than 91 percent of occupied housing units in the major metropolitan areas were constructed in suburban and exurban areas from 1950 to 2014. Conversely, less than 9 percent of the housing units were constructed in the urban cores (Figure 2). This is approximately one-third less than the share of the population living in the urban core. The owned housing figure was even lower, at 4.6 percent. Much more rental housing was constructed in the urban core, at 15.6 percent.
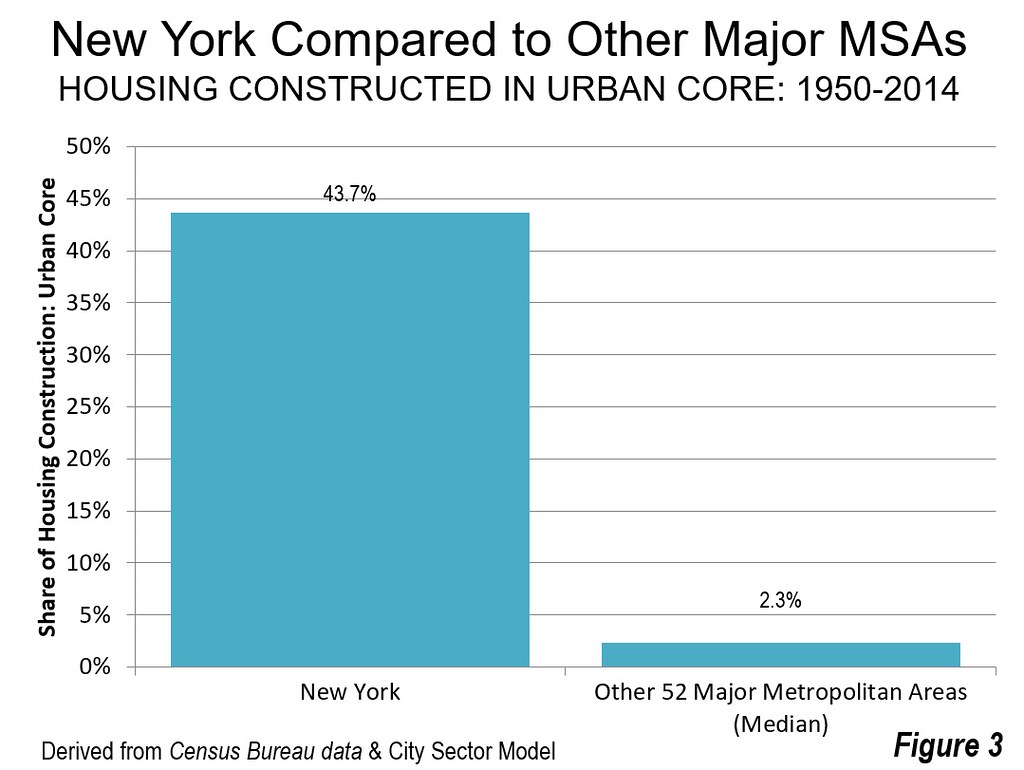
This turns out to be a familiar New York story (as in transit commuting, for example). In every major metropolitan area outside New York, 75 percent or more of the existing housing was built in the suburbs and exurbs between 1950 and 2014. In New York, the suburban and exurban share was 56.3 percent. New York's urban core captured 43.7 percent. This is 18 times the median suburban and exurban housing construction share for the other 52 major metropolitan areas (Figure 3).
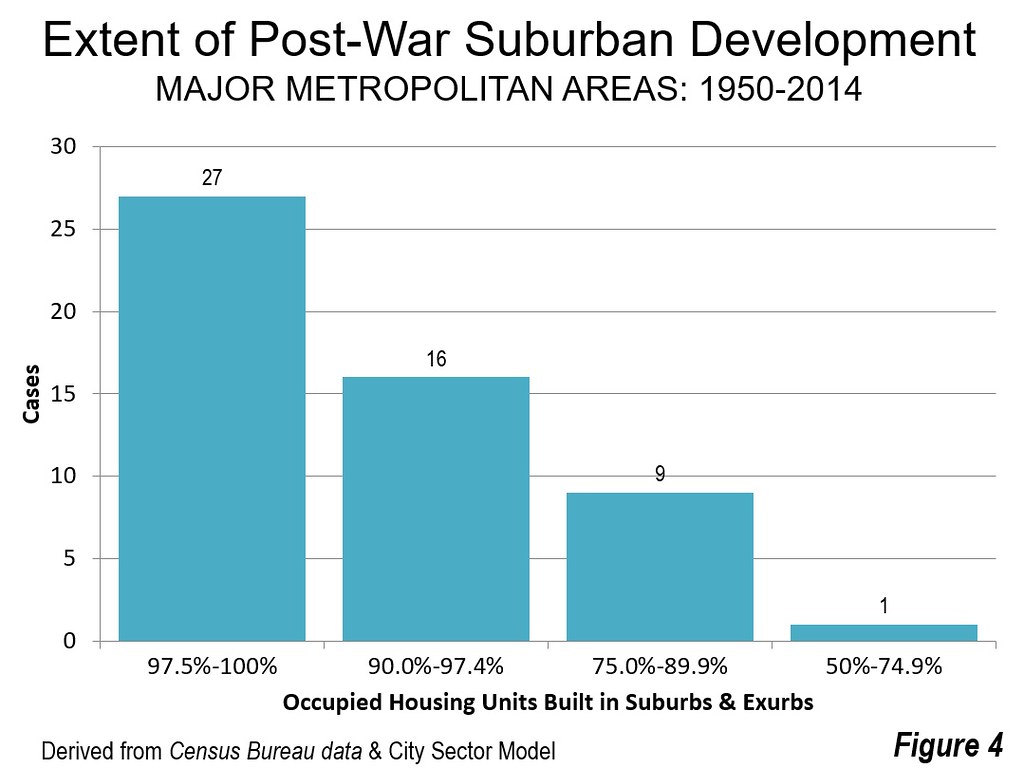
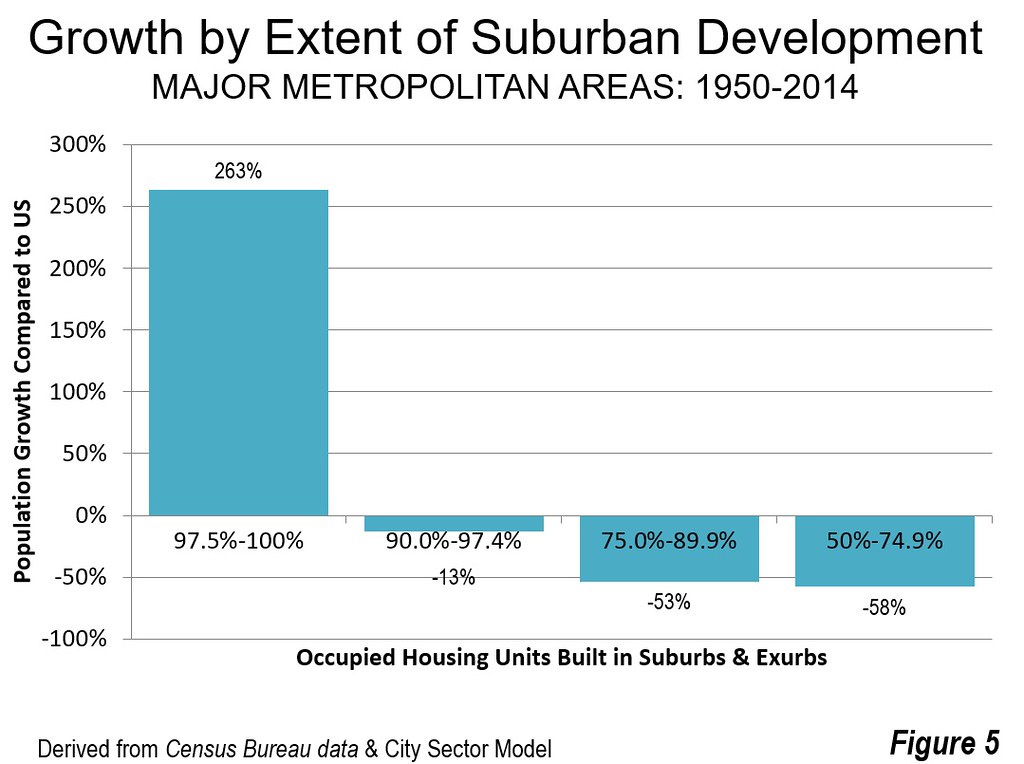
• In 27 major metropolitan areas, more than 97.5 percent of the housing units were constructed in the suburbs and exurbs.
• In 16 more major metropolitan areas, more than 90 percent of the housing units were constructed in the suburbs and exurbs.
• In nine major metropolitan areas between 75 percent and 90 percent of the housing units built from 1950 to 2014 were constructed in the suburbs and exurbs. In eight of these, the suburban and exurban figure was more than 80 percent, with Boston the lowest at 76 percent (Figure 4).
Perhaps the most important reason for a greater share of housing construction in the suburbs lay in faster population growth. Generally, metropolitan areas that grew faster than the national average over the 64 years had little or no urban core housing construction. Figure 5 shows that the median population growth rate among the 27 metropolitan areas with more than 97.5 percent of their 1950 or later housing built in the suburbs and exurbs was two and a half times the national growth rate over the same period. Generally speaking, the more housing was concentrated in the core, the slower the population growth. New York is the only metropolitan area with less than 75 percent of its growth in suburban and exurban areas, and experienced population growth 58 percent below the national average.
Pervasive Suburbanization: Housing Construction Over More than Six Decades
In a recent article, we characterized the recent annual Current Population Survey metropolitan migration data as indicating a “pervasive suburbanization.” This is nothing new. Over the past 64 years, the suburbs and exurbs have had a clear predominance in housing construction in most of the nation’s major metropolitan areas.
City Sector Model Note: The City Sector Model allows a more representative functional analysis of urban core, suburban and exurban areas, by the use of smaller areas, rather than municipal boundaries. The nearly 9,000 zip code tabulation areas (ZCTA) of major metropolitan areas are categorized by functional characteristics, including urban form, density and travel behavior. There are five functional classifications, two in the urban core (central business district, or CBD and inner ring), and three in the suburbs and exurbs (earlier suburban areas, later suburban areas and exurban areas), as indicated in Figure 6 below. The urban cores have higher densities, older housing and substantially greater reliance on transit, similar to the urban cores that preceded the great automobile oriented suburbanization that followed World War II. Exurban areas are beyond the built up urban areas.
Wendell Cox is principal of Demographia, an international public policy and demographics firm. He is a Senior Fellow of the Center for Opportunity Urbanism (US), Senior Fellow for Housing Affordability and Municipal Policy for the Frontier Centre for Public Policy (Canada), and a member of the Board of Advisors of the Center for Demographics and Policy at Chapman University (California). He is co-author of the "Demographia International Housing Affordability Survey" and author of "Demographia World Urban Areas" and "War on the Dream: How Anti-Sprawl Policy Threatens the Quality of Life." He was appointed to three terms on the Los Angeles County Transportation Commission, where he served with the leading city and county leadership as the only non-elected member. He served as a visiting professor at the Conservatoire National des Arts et Metiers, a national university in Paris.
Photograph: Levittown, Pennsylvania
https://upload.wikimedia.org/wikipedia/commons/6/64/LevittownPA.jpg


