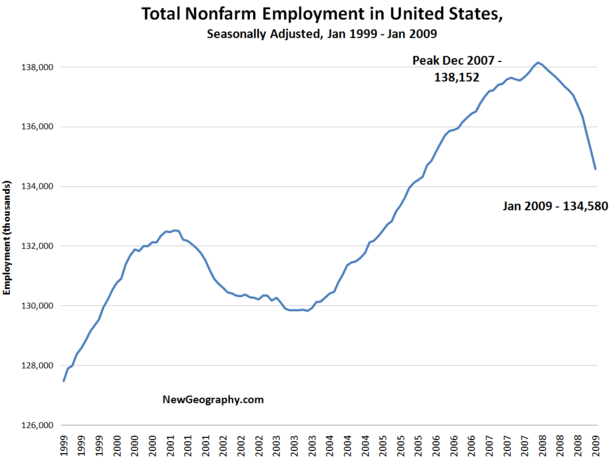
Here's a look at national employment change in the United States over the past 10 years. Nonfarm employment peaked in the US in December of 2007 at 138.1 million jobs. After a record loss of 598,000 jobs in the last month, we're now at 134.5 million. Thats a loss of more than 3.5 million jobs over the past year. Conveniently, 3.5 million jobs is exactly what Obama administration economists plan to create or save with the stimulus package.
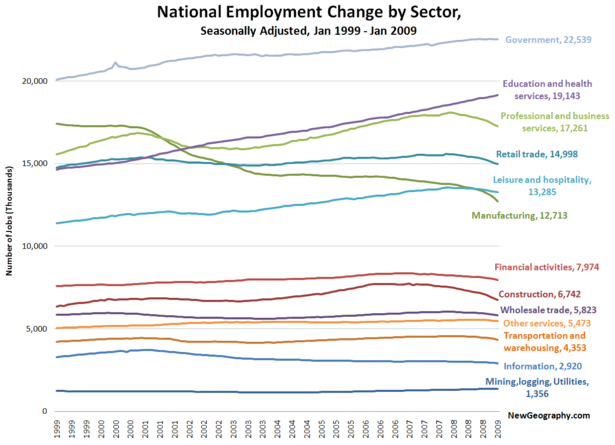
If we cut it by sector, recent job losses in manufacturing, construction, and professional and business services are striking. Over this same time period, we've added roughly 4.5 million jobs in education and health and another 2.5 million in government jobs. Perhaps the president is planning to hire those 3.5 million new employees directly?
If we index each sector back to January 1999, we can begin to see the trajectory of each industry over time. For this chart, the height of each line at a given point of time indicates percent growth over the January 1999 level. The heavy black line shows growth for all sectors.
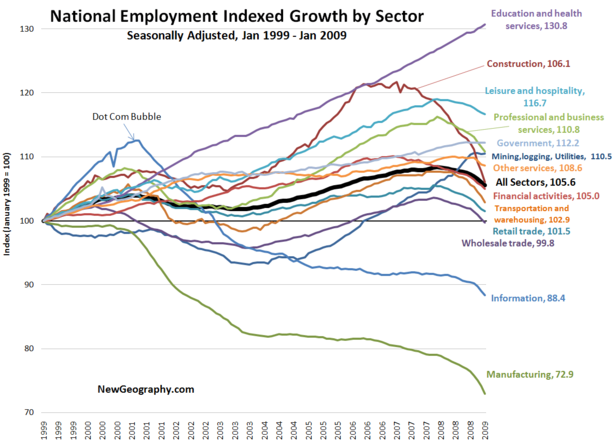
From here, the dot-com bust is obvious, as is the fact that the information sector has not recovered to pre-2000 levels. Information may be even more trouble in the short term, as that sector includes media and publishing.
The construction employment boom began in mid 2003 and eventually reached more that a 20% premium over 1999 before falling back to mid 2003 levels last month.
Manufacturing has fallen precipitously with this bust, we are now seeing marked declines in other goods-supporting industries: wholesale trade and transportation and warehousing.
Again, institutional sectors of Government (up 12%) and eds and meds (up 30%) lead the way. The other fastest growing sector since 1999? Leisure and hospitality. Staycation, anyone?


