
Home ownership is finally increasing in the United States, following the housing bust. The Census Bureau reports that 63.9 percent of households owned their own homes in 2017. This represents the first annual home ownership increase in more than 10 years, as a string of losses followed the housing bust after 2006. The home ownership rate has continued to increase, and stood at 64.4 percent in the third quarter of 2018. This is just above the 64.3 percent average home ownership rate for the three decades ending in 1994. Much of the subsequent increase in home ownership was the result of the housing bubble (Figure 1). The authors of a Federal Reserve Bank of San Francisco working paper (Paolo Gelain of the European Central Bank and Norges Bank, Kevin J. Lansing of the Federal Reserve Bank of San Francisco and Gisle J. Natvik of the BI Norwegian Business School) characterized this as:
… a classic speculative bubble involving naive projections about future asset values, imprudent lending against risky collateral, and ineffective regulatory oversight."
Much of the angst about falling home ownership since the Great Financial Crisis insufficiently accounts for unusual, and hopefully not to be repeated influences. Yet the differences between metropolitan areas are enormous.

Highest Home Ownership Rates
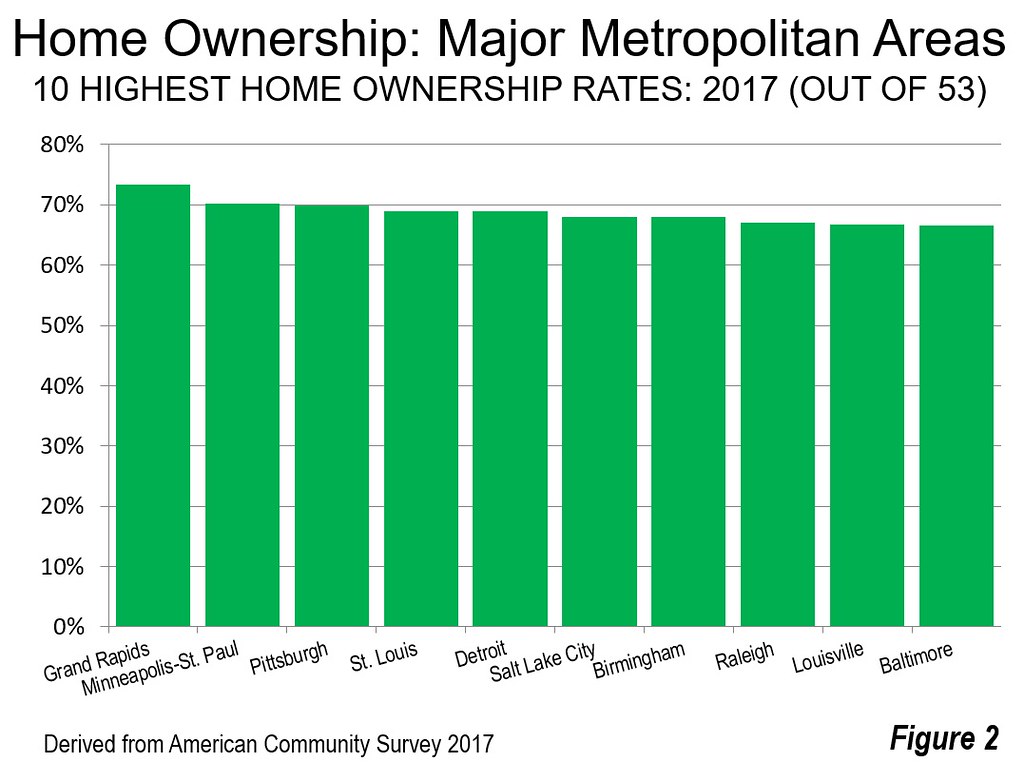
The data from the American Community Survey shows that Grand Rapids, Michigan has the highest home ownership rate among the 53 major metropolitan areas (over 1,000,000 population). With 73.4 percent of households owning homes, Grand Rapids has a 3.2 percentage point margin over second ranked Minneapolis-St. Paul (Minnesota-Wisconsin), which has a 70.2 percent home ownership rate. Grand Rapids and Minneapolis-St. Paul are the only major metropolitan areas with home ownership rates exceeding 70 percent. The table shows home ownership rates for the 53 major metropolitan areas.
Pittsburgh, St. Louis (Missouri-Illinois) and Detroit ranked third through fifth in home ownership, they were followed by Salt Lake City, Birmingham, Raleigh, Louisville (Kentucky-Indiana), and Baltimore. All of the top ten metropolitan areas had home ownership rates of 66.6 percent or higher (Figure 2).
Lowest Home Ownership Rates
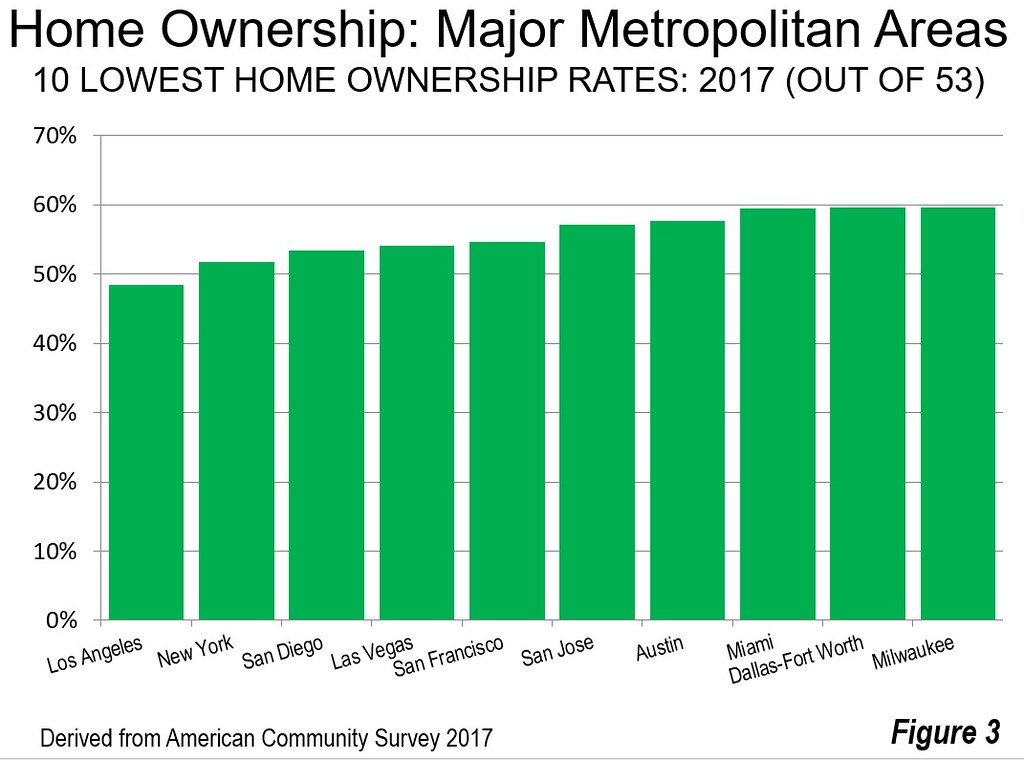
The lowest home ownership rate was in Los Angeles, at 48.4 percent (a ranking of 53rd). This is more than one third below that of leader Grand Rapids and 3.4 percentage points below New York (New York-New Jersey-Pennsylvania), at 51.8 percent. Three other metropolitan areas had home ownership rates below 55 percent, 51st ranked San Diego, 50th ranked Las Vegas, and 49th ranked San Francisco. The other metropolitan areas among the lowest 10 home ownership rates were all below 60 percent, San Jose, Austin, Miami, Dallas-Fort Worth, and Milwaukee (Figure 3).
California’s Low Home Ownership Rates
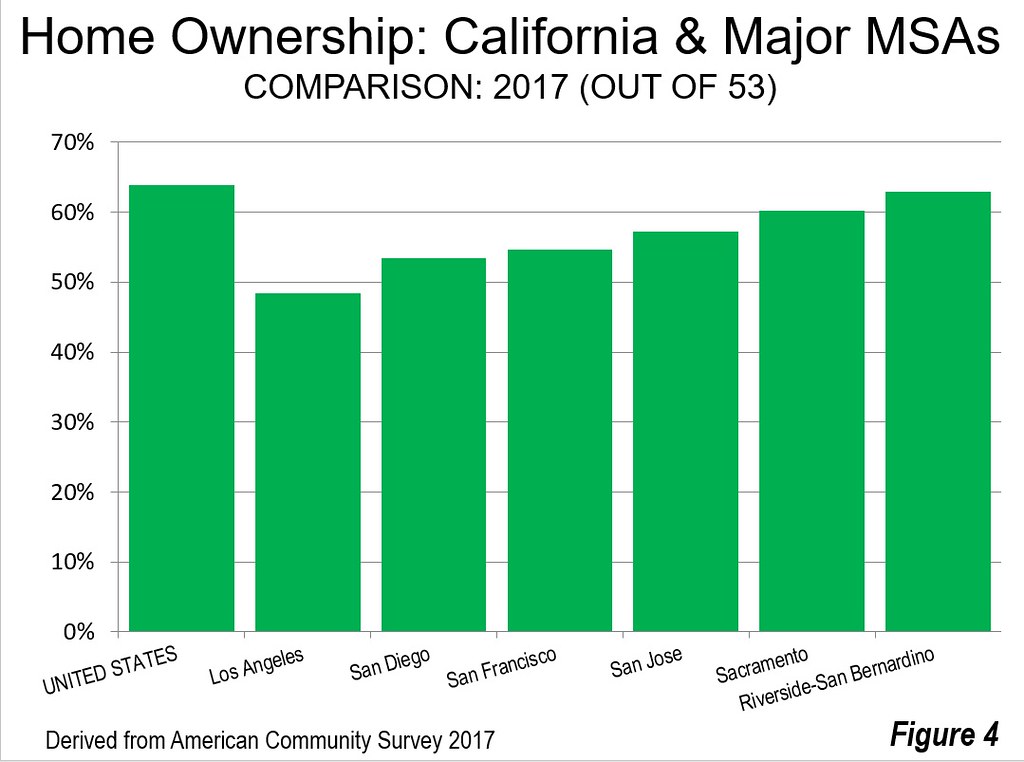
California’s major metropolitan areas are disproportionately ranked with among the lowest home ownership rates. None has a home ownership rank in the top one-half of metropolitan areas. Four of the six metropolitan areas with the lowest home ownership rates are in California, including the two largest. The Los Angeles home ownership rate is nearly one-quarter below that of the nation. The San Francisco home ownership rate is 14 percent below the national rate. The fourth largest metropolitan area, San Diego, has a home ownership rate 16 percent below that of the nation. San Jose, with the highest median income of any major metropolitan area, has a home ownership rate 10 percent below the US rate.
While Sacramento is not among the 10 metropolitan areas with the lowest home ownership rates in the nation, it ranks 12th worst, at six percent below the national rate. Only Riverside-San Bernardino has a home ownership rate nearly equal to that of the nation, at 63.0 percent.
There have been multiple reports from California’s Legislative Analyst, as well as others tracing much of the higher housing costs to some of the most restrictive land use regulations, in a state with the highest urban population density in the nation. Further, California’s high house prices make it far more expensive to provide subsidized, affordable housing because its costs are tied to housing costs in the market. A consequence is that California has the highest housing cost adjusted poverty rate among the 50 states.
The Importance of Home Ownership
In a recent article, Cullum Clark, Director of the Bush Institute-SMU Economic Growth Initiative, reminds us that home ownership has been a priority of presidents since FDR (see: The Benefits of Home Ownership Mean We Should Still Believe in the American Dream). He says that “Providing a 'hand-up' to help lower-income people onto the first rung of the ladder to stable asset ownership is one of the most powerful engines for upward mobility and a sustainable middle class.” This is crucial to a prosperous and inclusive future.
Improving home ownership does not require liar loans or dishonestly rated securities. It can be accomplished by allowing competitive land markets to operate. This requires allowing starter housing to be built that can be afforded by the starter home consumers of the future, such as millennials and many minority households.
| US Home Ownership Rates | ||
| Major Metropolitan Areas: 2017 | ||
| Rank | Metropolitan Area | Rate |
| 1 | Grand Rapids, MI | 73.39% |
| 2 | Minneapolis-St. Paul, MN-WI | 70.19% |
| 3 | Pittsburgh, PA | 69.90% |
| 4 | St. Louis,, MO-IL | 68.90% |
| 5 | Detroit, MI | 68.89% |
| 6 | Salt Lake City, UT | 68.03% |
| 7 | Birmingham, AL | 67.98% |
| 8 | Raleigh, NC | 67.00% |
| 9 | Louisville, KY-IN | 66.79% |
| 10 | Baltimore, MD | 66.62% |
| 11 | Rochester, NY | 66.62% |
| 12 | Hartford, CT | 66.49% |
| 13 | Richmond, VA | 66.24% |
| 14 | Philadelphia, PA-NJ-DE-MD | 66.06% |
| 15 | Cincinnati, OH-KY-IN | 65.92% |
| 16 | Charlotte, NC-SC | 65.60% |
| 17 | Buffalo, NY | 65.54% |
| 18 | Indianapolis, IN | 65.44% |
| 19 | Nashville, TN | 65.02% |
| 20 | Kansas City, MO-KS | 64.60% |
| 21 | Cleveland, OH | 64.43% |
| 22 | Chicago, IL-IN-WI | 64.38% |
| 23 | Tampa-St. Petersburg, FL | 64.38% |
| 24 | Denver, CO | 64.14% |
| 25 | Tucson, AZ | 63.87% |
| 26 | Phoenix, AZ | 63.67% |
| 27 | Jacksonville, FL | 63.64% |
| 28 | Washington, DC-VA-MD-WV | 63.63% |
| 29 | Oklahoma City, OK | 63.51% |
| 30 | San Antonio, TX | 63.27% |
| 31 | Portland, OR-WA | 63.21% |
| 32 | Riverside-San Bernardino, CA | 62.99% |
| 33 | Atlanta, GA | 62.96% |
| 34 | New Orleans, LA | 62.18% |
| 35 | Virginia Beach-Norfolk, VA-NC | 61.95% |
| 36 | Providence, RI-MA | 61.86% |
| 37 | Boston, MA-NH | 61.84% |
| 38 | Columbus, OH | 61.78% |
| 39 | Houston, TX | 60.74% |
| 40 | Orlando, FL | 60.45% |
| 41 | Memphis, TN-MS-AR | 60.29% |
| 42 | Sacramento, CA | 60.25% |
| 43 | Seattle, WA | 59.99% |
| 44 | Milwaukee,WI | 59.68% |
| 45 | Dallas-Fort Worth, TX | 59.66% |
| 46 | Miami, FL | 59.46% |
| 47 | Austin, TX | 57.71% |
| 48 | San Jose, CA | 57.18% |
| 49 | San Francisco, CA | 54.64% |
| 50 | Las Vegas, NV | 54.19% |
| 51 | San Diego, CA | 53.49% |
| 52 | New York, NY-NJ-PA | 51.83% |
| 53 | Los Angeles, CA | 48.42% |
| Derived from American Community Survey 2017 | ||
Photograph: Grand Rapids
Credit:
https://en.wikipedia.org/wiki/Grand_Rapids,_Michigan#/media/File:Grand_R...


