
Ninety years have made a world of difference in the United States. Between 1920 and 2010, the nation's population nearly tripled. But that was not the most important development. Two other trends played a huge role in shaping the United States we know today. The first trend was increasing urbanization, a virtually universal trend, but one which occurred earlier in the high income countries, while the other was a rapidly falling average household size.
National Trends
In 1920, the United States had just crossed the same 50 percent urbanization threshold that China recently crossed. By 2000, the United States was 81 percent urban.
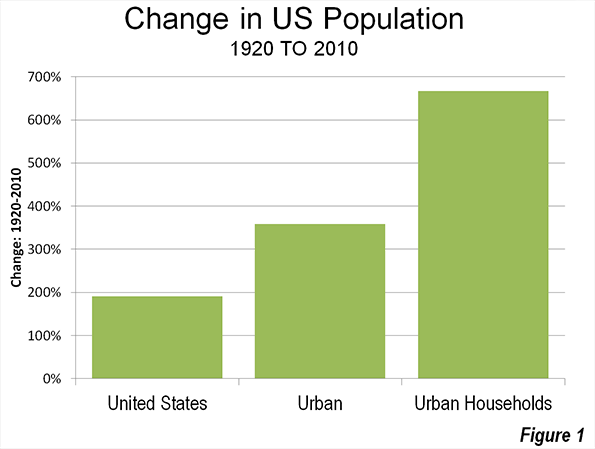
The second trend was even more significant. Average household size has fallen from 4.6 in 1920 to 2.6 by 2000, where it remained in the 2010 census. The result is that there are now 7.7 times as many households (Note 1) in urban areas as there were in 1920 (Figure 1).
Urban Area Trends
In the 1960s, the Urban Land Institute sponsored research by Jerome P. Pickard (Note 2) to replicate urban area population and density data going back to 1920, using the generalized criteria that had been developed by the Census Bureau for the 1950 and 1960 censuses.
According to Pickard's work, there were five urban areas in the United States with more than 1 million population in 1920. Unfortunately, the publication did not include Detroit, which undoubtedly had an urban area population of more than 1 million in 1920 (Note 3). In addition, Pickard found nine urban areas with populations between 500,000 and 1 million.
By contrast, today there are 42 urban areas with more than 1 million population and 38 with between 500,000 and 1 million population.
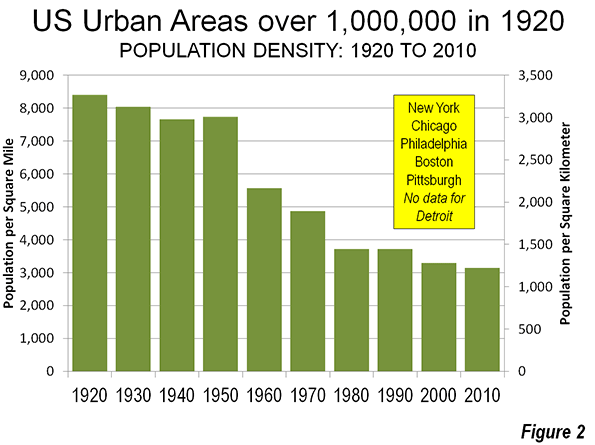
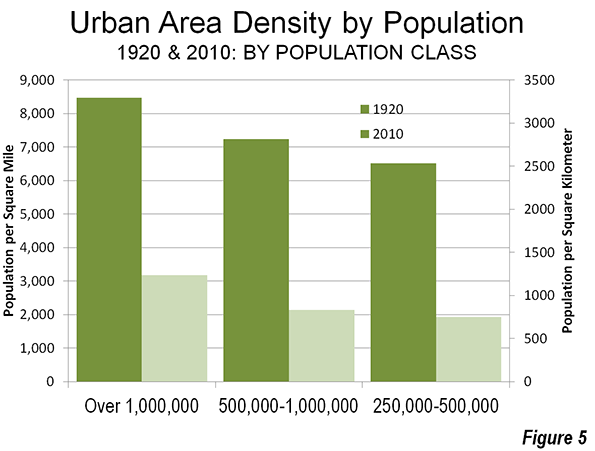
In 1920, the five major urban areas for which there is data had an overall population density of 8,400 per square mile (3,700 per square kilometer). This figure dropped continually, except for between 1940 and 1950 as to its present level (Figure 2) of approximately 3,100 per square mile (1,200 per square kilometer).
However, caution is required, because before 2000, urban areas generally contained only complete municipalities. Two of the nation's major urban areas had substantial rural (greenfield) expenses inside their core cities in 1920. This was most pronounced in the core city of New York, where most of Queens and most of Staten Island were undeveloped. Between 1920 and 2010, these two boroughs added more than 1.8 million population, most of which was on greenfield land, rather than the densification of the existing urban neighborhoods. This was in effect, suburban expansion within the city of New York. The same dynamics occurred, to a lesser degree in core cities such as Philadelphia and Los Angeles.
Pickard finds a population density of 10,600 per square mile (4,100 per square kilometer) for the New York urban area in 1920. It had fallen by half to 5,300 per square mile (2,050 per square kilometer) by 2010.
Core City and Suburban Growth
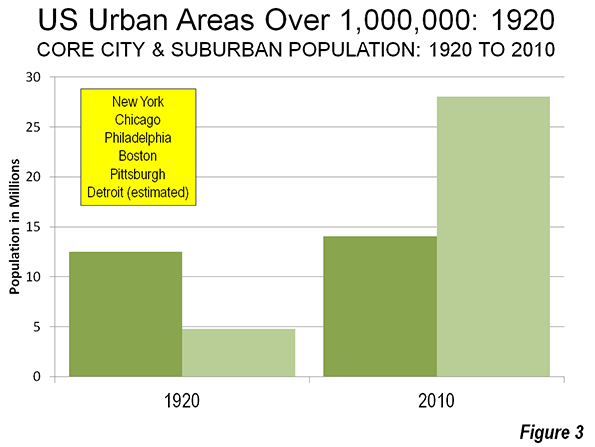
Over the period, the bulk of the population growth (92 percent) was in the suburbs (Figure 3). Even that figure, however, understates the extent of suburban growth. As was above, the inclusion of rural areas as urban in municipalities appears to have been a major driver of the population increase in the city of New York, which added 2.4 million people between 1920 and 2010. Among the other five major urban areas, which includes an estimate for Detroit (Note 2), the core municipalities lost population in each case over the 90 years, though they all continued to grow at least until 1950.
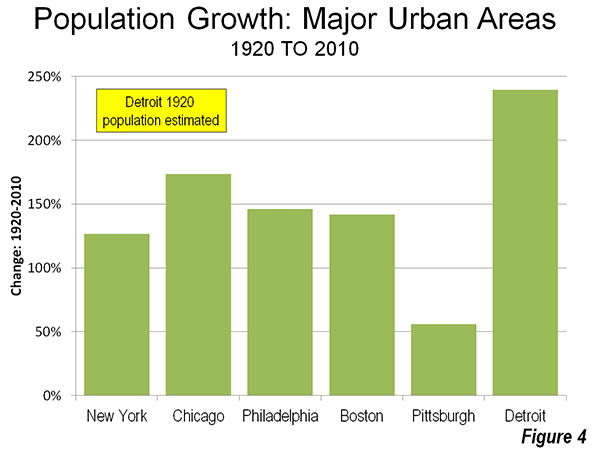
All of the six major urban areas in 1920 were in the Northeast or the Midwest. The fastest growing urban area from 1920 to 2010 among the six was Detroit, despite the huge losses of its core municipality (Figure 4). No municipality in the world of Detroit's 1950 size (1.85 million) has lost so much of its population (1.1 million) in all of history. Yet, the Detroit urban area is estimated to have added approximately 2.6 million people to its urban area population since 1920, for an approximately 240 percent increase in population. The Detroit urban area peaked in 2000 at 160,000 higher than in 2010. The second fastest growing larger urban area was Chicago, at approximately 175 percent, while Philadelphia gained 146 percent and Boston 142 percent.
Urban Areas with 500,000 to 1,000,000 Population in 1920
The nine urban areas with 500,000 to 1,000,000 population in 1920 had a much lower population density, at 7,200 per square mile (2,800 per square kilometer). This figure, however, is artificially low because of the Los Angeles urban area's extremely small 1920 density (1,700 per square mile or 650 per square kilometer). Just a few years before the 1920 census, Los Angeles had annexed the San Fernando Valley and other largely rural areas. As a result the city quadrupled in land area. Again, the inclusion of rural areas in the core city rendered Pickard's urban area (and that of the Census Bureau to at least in 1950) unreflective of actual urban densities in Los Angeles.
Milwaukee: More Dense than New York
The Milwaukee urban area, with a population of 504,000 had the highest density in the nation, at 10,900 per square mile (4,200 per square kilometer), which was the last time before 1990 that the New York urban area was not the most dense major urban area. In 1990, the Los Angeles area became more dense than the New York urban area. By 2000, both the San Francisco and the all-suburban San Jose urban area had also passed New York,
Falling Densities and Causes
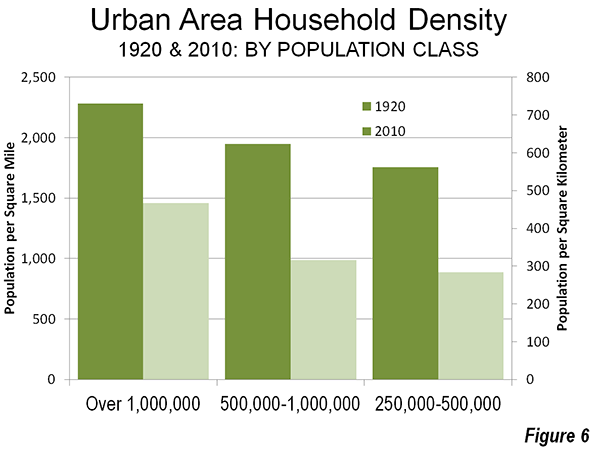
The population density declines were substantial over the period, at from 63 percent to 70 percent. At the same time, falling household sizes created the requirement for more houses and household densities fell at a slower rate, 37 percent in the largest areas and 50 percent in the smaller metropolitan areas. There were other factors as well, such as more efficient manufacturing and commercial operations, that took more space, urban planning requirements in some metropolitan areas (such as Boston and Atlanta) that required larger than market building lots (large lot zoning)and the general preference for more land and space on the part of consumers. The US has not been alone in this. The trend toward lower densities has been virtually universal, from Mumbai and Manila to Moscow and Milan.
Wendell Cox is a Visiting Professor, Conservatoire National des Arts et Metiers, Paris and the author of “War on the Dream: How Anti-Sprawl Policy Threatens the Quality of Life.
----
Note 1: Assumes the same average household size for urban and rural areas.
Note 2: Jerome P. Pickard, Dimensions of Metropolitanism, Urban Land Institute, 1967.
Note 3: In 1920, the municipality of Detroit had a population of 993,000 and a population density of 12,700 per square mile (4,900 per square kilometer). Wayne County, which includes Detroit, had a population of 1,170,000. The land area of the county was approximately nine times that of the municipality, nearly all of it rural. On that basis it is estimated that the urban area would have had no more than 1,100,000 residents.
Photo: New York in the 1920s (Singer Building in foreground, Woolworth Building in the background). Photograph by the U.S. Census Bureau, Public Information Office (PIO).


sam
Rapid population growth. how the government in regulating the response of the people who continue to multiply it? szczoteczka do zębów
Salmon-Safe, which began as
Salmon-Safe, which began as a program designed to help farmers restore salmon streams, is the only certification program in the country specifically dedicated to protecting water quality and habitat for salmon szczoteczka do zębów
If some one wants expert
If some one wants expert view concerning blogging and site-building afterward i advise him/her to go to see this webpage, Keep up the good job.penghilang bulu * body slim herbal
My friend mentioned to me
My friend mentioned to me your blog, so I thought I’d read it for myself. Very interesting insights, will be back for more Twitch
Very interesting to read
Very interesting to read this article.I would like to thank you for the efforts you had made for writing this awesome article.grosir kosmetik
fruit plant
With havin so much written
With havin so much written content do you ever run into any issues of plagorism or copyright violation? My blog has a lot of completely unique content I’ve either written myself or outsourced but it appears a lot of it is popping it up all over the internet without my agreement.
jual cctv
cctv murah
obat peninggi badan
obat peninggi badan
We are really grateful for
We are really grateful for your blog post. You will find a lot of approaches after visiting your post. Great work.perontok bulu permanen
You have done a great job. I
You have done a great job. I will definitely dig it and personally recommend to my friends. I am confident they will be benefited from this site.cheap seo services
It will be really valuable
It will be really valuable for you to select the SEO company which guarantees the value of cash and obat pelangsing
“By a Baltimore
“By a Baltimore astrophysicist. It’s extremely accessible book about how the bigger the scientific intellect, the bigger the blunder,” says Ed. “But it goes on to tell how each of these blunders led to even bigger discoveries.” PublicorPrivate.nl