.JPG")
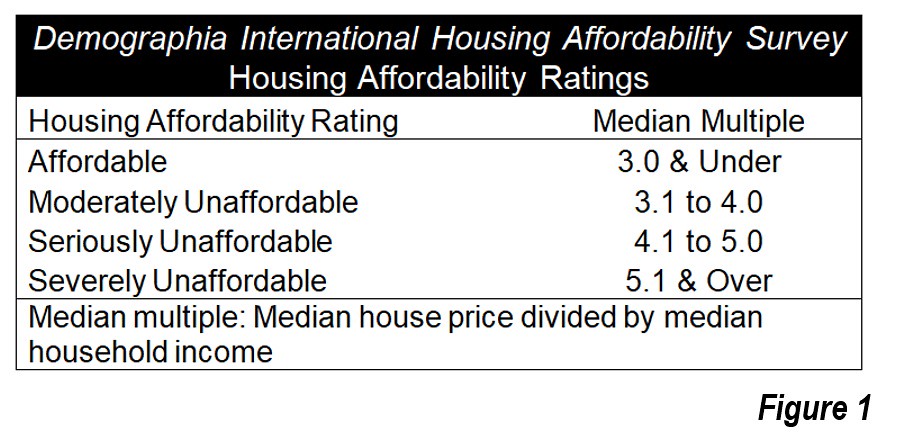
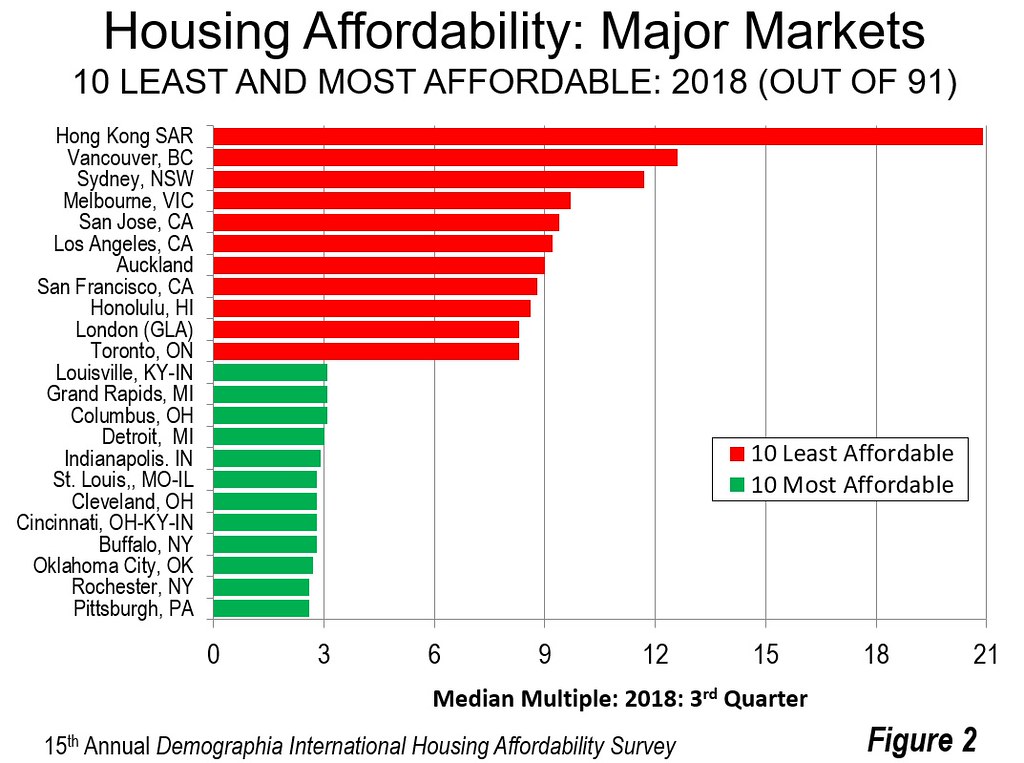
Pittsburgh and Rochester have the best housing affordability among 91 major markets (metropolitan areas with more than 1,000,000 population) in eight nations. Both have a median house price that is 2.6 times the median household income, a measure called the Median Multiple. This is the conclusion of the 15th Annual Demographia International Housing Affordability Survey, which rates housing markets based on estimates from the 3rd quarter of 2018.
Other Affordable Major Markets
Seven other major markets in the Survey are rated as affordable (Figure 1), with Median Multiples of 3.0 or less. They include Oklahoma City (2.7), Buffalo, Cincinnati, OH-IN-KY, Cleveland, and St. Louis, MO-IL, at 2.8, Indianapolis at 2.9, and Detroit at 3.0 (Figure 2).
Severely Unaffordable Major Markets
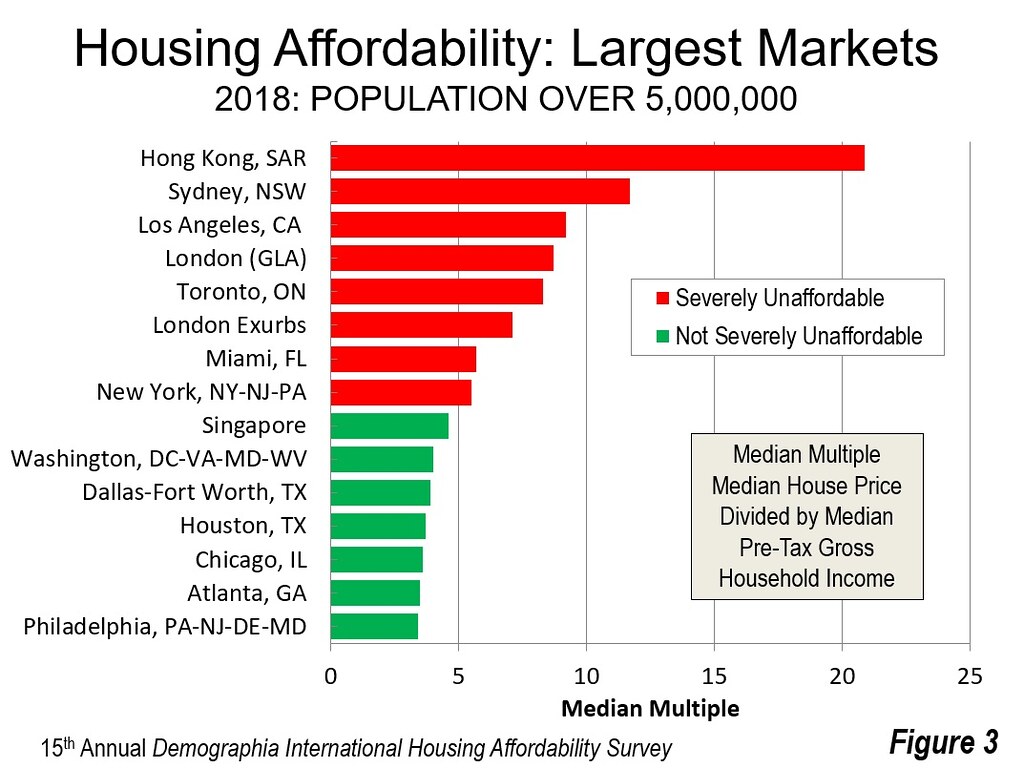
While households in affordable markets can buy middle-income houses for the equivalent of three years or less of gross median income, households in some other markets need from 10 years to over 20 years income to pay for their houses (Hong Kong, Vancouver, and Sydney).
For the ninth year in a row, the Demographia International Housing Affordability Survey shows Hong Kong to be the least affordable major housing market. Hong Kong's Median Multiple is 20.9, up from 19.4 last year. This is the highest Median Multiple in the Survey’s 15-year history.
The Major Markets
In addition to the very large markets noted above, the least affordable 10 includes Vancouver, which at 12.6 the third second least affordable major market, retaking that position from Sydney, after four years. Melbourne had a Median Multiple of 9.7, followed by San Jose (9.4), Los Angeles (9.2) and Auckland (9.0). The balance of the least affordable 10 included San Francisco (8.8), Honolulu (8.6) along with London (Greater London Authority) and Toronto, both at 8.3.
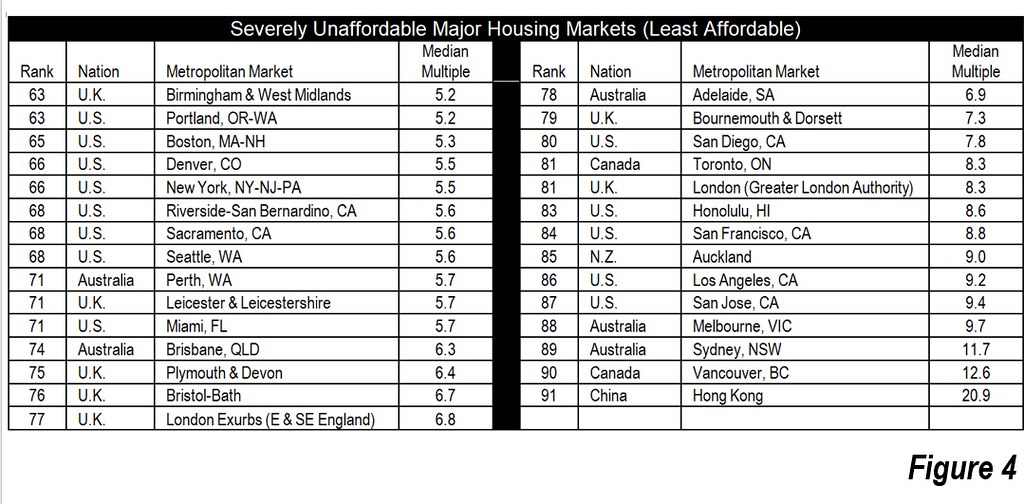
There are 29 severely unaffordable markets, which are shown in Figure 4. These include all major markets in Australia (5) and New Zealand (1). Two of Canada's six major metropolitan areas and six of the United Kingdom's 21 major markets, including London and the London Exurbs. There are 13 severely unaffordable markets is in the United States. This represents, however, less than one-quarter of its 54 rated markets.
All 309 Markets
Among the 309 markets of all sizes in the Survey, 79 are severely unaffordable, with 28 in the United States (out of 188), 16 in Australia (out of 23), 17 in Canada (out of 50), 11 in the United Kingdom (out of 33) and six in New Zealand (out of eight). There are no severely unaffordable markets in Ireland or Singapore.
There are also 62 affordable markets (Median Multiple of 3.0 and less --- 49 in the United States, 11 in Canada, two in Ireland and one in Australia. There are no severely unaffordable markets in Ireland or Singapore. Canada’s Cape Breton, NS is the most affordable of the 309 markets, with a Median Multiple of 2.1.
Introduction (“Avoiding Dubious Urban Policies”) by Alain Bertaud
This year’s Introduction (“Avoiding Dubious Urban Policies”) is by Alain Bertaud, of New York University (NYU) and former principal urban planner at The World Bank. Bertaud has just published a much anticipated book (Order without Design: How Markets Shape Cities) expressing concern that urban planning is ignoring fundamental economics, which can lead to a “costly utopia.”
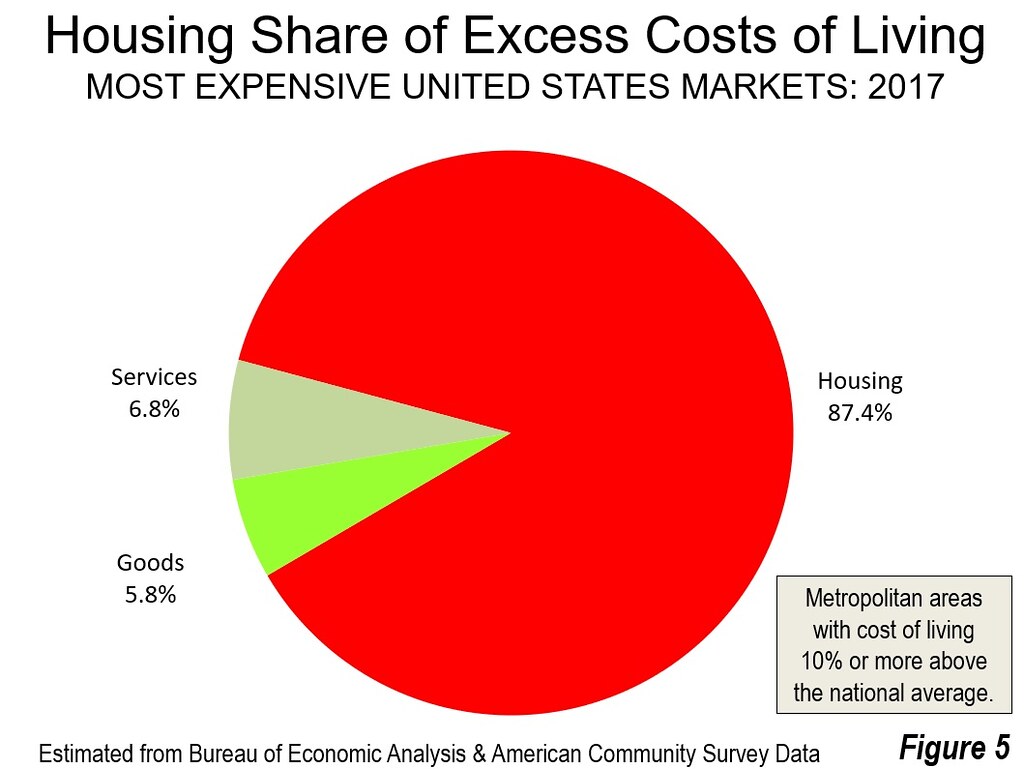
In the book, he blames “the lack of interaction” between urban planning and urban economics” for the “serious dysfunction in the development of cities,” and calls for incorporation of economics into urban policy. Berthoud elevates the issue of housing affordability to its genuine significance, suggesting that: The main objective of the planner should be to maintain mobility and housing affordability. Obviously, mobility is important because of the need for people to reach work in metropolitan areas (see: “Employment Access in US Metropolitan Areas”). Housing affordability drives the cost of living. Nearly all the cost difference between high cost metropolitan areas and the national average is the difference in housing costs (Figure 5).
In the Introduction, Bertaud discusses notes the necessity of providing more housing “rapidly enough to accommodate the new demand without creating real estate price inflation.” Virtually all the severely unaffordable markets have failed in this task. Bertaud says that the necessary “expansion is blocked by inadequate land management policies and arbitrary land use regulations, and by an absence of mechanisms to finance infrastructure and transport to respond to demand for new greenfield land development.” However, public officials are often “are not effective in allowing the supply of floor space and land to increase rapidly because many of them firmly believe in three myths:”
Myth #1: planners know how to allocate land equitably through the design of increasingly complex zoning regulations while ignoring price signals.
Myth #2: Regulators can mandate the creations of new affordable housing units by obliging private developers to provide a share (usually 20%) of the housing units they build at prices fixed by the government below market; regulators call these “affordable housing units.”
Myth #3: The compact city fallacy. A city can accommodate increasing income and population through densification of the existing built-up area; expansion into greenfield would result in “sprawl.”
The mindsets resulting from these myths have dire consequences. Middle-income households are increasingly unable to afford middle-income housing, because their prices have been driven up by excessive regulation. More households are added to the queue for subsidized housing, as they can no longer afford the market rate housing that has increased so much in price. With this demand, induced by excessive regulation, its governments typically have long waiting lists for subsidized housing. It is not surprising that homelessness is increasing in this environment. When people must pay more for housing relative to their incomes, they have less for other goods and services. This explains how California, home to some of the world’s greatest wealth, is also home to the highest poverty rate among the 50 states when housing costs are considered.
But reform is challenging. Bertaud summarizes the solution, “…urban regulatory reform” should be approached “…in the same way as a doctor develops a treatment for a drug addict: a progressive withdrawal planned over the long term. The main lesson to be drawn is not to become addicted to dubious urban regulations in the first place. I wish planning professional associations, and academic institutions would contribute to dispelling the three myths described above that are causing so many urban dysfunctions.”
Finally, in “Avoiding Dubious Urban Policies,” Berthoud characterizes the Demographia Survey message to be that unaffordable housing is not an unavoidable fatality linked to economic success. We have not said it better before.
15th Annual Demographia International Housing Affordability Survey
Wendell Cox is principal of Demographia, an international public policy and demographics firm. He is a Senior Fellow of the Center for Opportunity Urbanism (US), Senior Fellow for Housing Affordability and Municipal Policy for the Frontier Centre for Public Policy (Canada), and a member of the Board of Advisors of the Center for Demographics and Policy at Chapman University (California). He is co-author of the "Demographia International Housing Affordability Survey" and author of "Demographia World Urban Areas" and "War on the Dream: How Anti-Sprawl Policy Threatens the Quality of Life." He was appointed to three terms on the Los Angeles County Transportation Commission, where he served with the leading city and county leadership as the only non-elected member. He served as a visiting professor at the Conservatoire National des Arts et Metiers, a national university in Paris.
Photograph: Pittsburgh & Rochester - Best 2018 International Housing Affordability


