
The 2019 update of Demographia World Urban Areas, just released, provides population, urban land area, and average urban density estimates for the known 1,072 urban agglomerations with 500,000 or more residents (called “larger urban areas: in this article). The report can be downloaded here.
Distribution of World Population by Urban Area Size
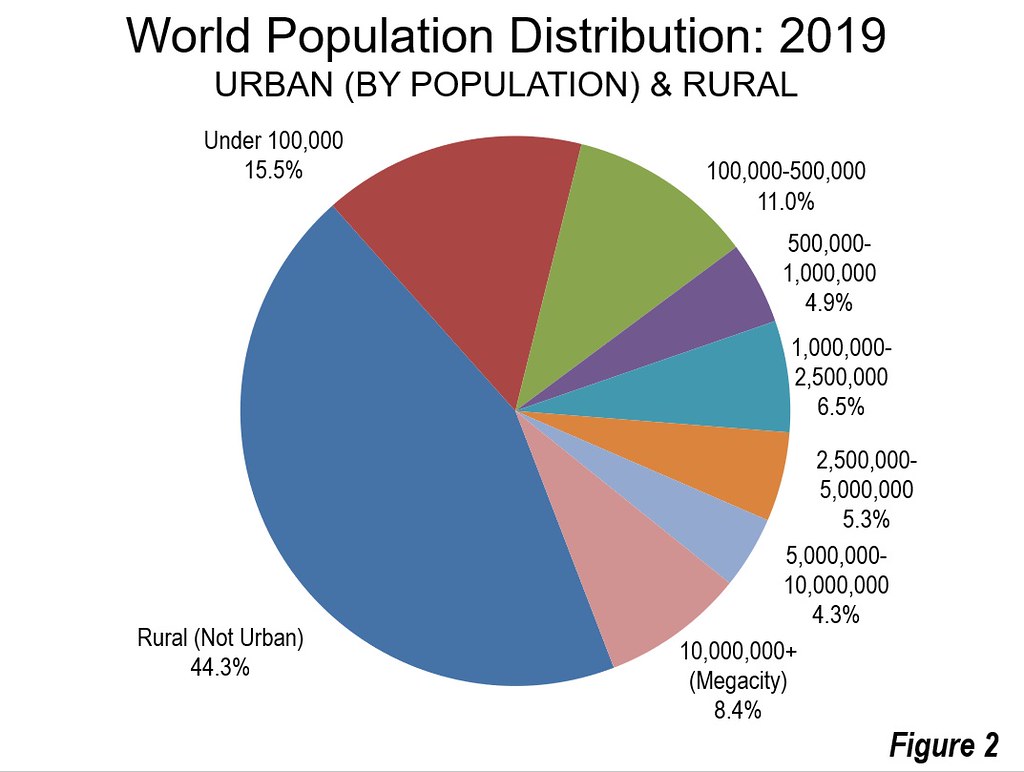
For some time, some media and academics have been fascinated by the world now being more than one-half urban (54 percent), imagining that the typical urban resident lives in the largest cities, like Tokyo, New York, Shanghai or London. Not so --- the 38 megacities, urban areas with 10 million or more residents, have only 8.4 percent of the world’s population (Figure 1). The median (middle) world resident lives in an urban area with a population of approximately 625,000 --- half live in larger urban areas and the other half lives in smaller urban areas or outside urban areas (rural areas). Thus, the average resident lives in an urban area about the size of Bakersfield, California (USA), Zhoushan, Zhejiang (China), Erode, Tamil Nadu (India), Uberlandia, Minas Gerais (Brazil) or Nuremburg, Bavaria (Germany), none of which is among the largest urban areas in their respective countries nor even their secondary jurisdictions (state, province or lander).

Another 4.3 percent live in the 49 additional urban areas with more than 5,000,000 residents. In fact, a substantial majority --- nearly 60 percent --- of the world population is estimated to live in smaller urban areas (100,000 and below) and outside urban areas, which are, by definition, rural (Figure 2).
Geographic Distribution of World Urban Areas
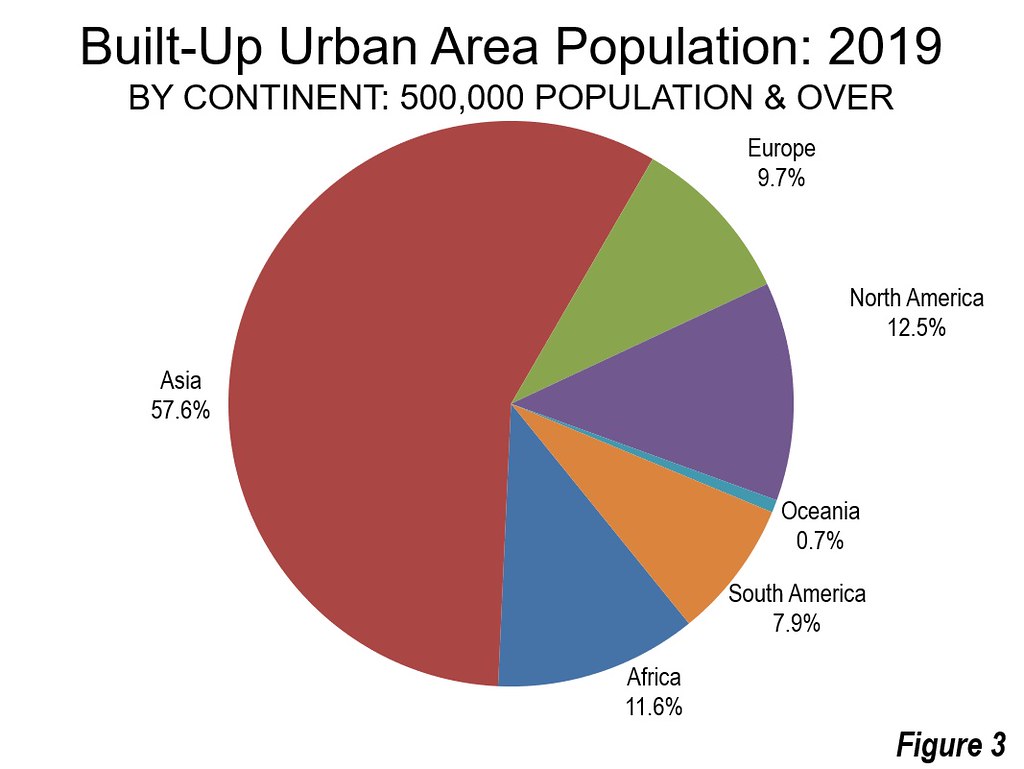
Asia continues to be dominant in terms of big cities, with nearly 58 percent of the population in larger urban areas (Figure 3). This is approximately five times as many larger urban area residents as in North America or Africa. Further, Asia has more than five times as many larger urban area residents as Europe and eight times that of South America. All population in the 500,000+ urban areas of Australia and New Zealand combines to equal that of Moscow or Bangkok, and only slightly larger than Los Angeles (16.4 million).
The Largest Urban Areas
As has been the case for six decades, Tokyo-Yokohama is the world’s largest urban area, with a population of 38.5 million. Jakarta continues to close the gap, now ranking number two at 34.4 million (Note 1). Delhi continues to hold third position at 28.1 million, and is now estimated to have 4.5 million more residents than India’s long time leader, Mumbai (ranked 6th). Manila ranks fourth (Note 1), while Seoul-Incheon ranks fifth. Population estimates have been recalibrated for Shanghai and Beijing, reflecting the success of population control strategies, according to annual statistical communiqués (see: Beijing and Shanghai Limit Growth). Shanghai fell from 5th position to 7th position, having been passed by Seoul-Incheon and Mumbai. New York, Sao Paulo and Mexico City were ranked 8th through 10th. Eighth ranked New York was the largest urban area in the world for three decades from the 1920s to 1955.
While growth has virtually stopped in Shanghai and Beijing, the third largest in China, Guangzhou-Foshan (Figure 4) has continued to grow and is now ranked 11th in the world. Guangzhou-Foshan is now estimated to have a larger population than Beijing (12th), which had been China’s second largest urban area since United Nations data began in 1950. Beijing was the world’s largest urban agglomeration for longer than any other urban area since 1500, having led the world most of the 16th Century, and most of the 18th Century until 1825. London became the largest at that point. Beijing had been the first to reach 1,000,000 population in modern times (see: Bar Chart Race --- The Most Populous Cities in the World).

London, which has only recently reached megacity status, and now ranks 35th, at below 11 million, ranked as the world’s most populous urban area for 100 years before being dethroned by New York in the 1920s.
Three Decades of Growth: Largest Cities
There have been substantial changes in urban area rankings in the last three decades, as is indicated in Figure 5. Tokyo-Yokohama has retained its top position. Other high-income world cities have done less well. Osaka-Kobe-Kyoto, which ranked second in 1990, has dropped 12 positions to 14th. Formerly third ranked New York dropped from third to eighth. Los Angeles, which spent decades as perhaps the fastest growing high-income world city outside Tokyo, fell from 8th to 18th. Comparable data is not available for Seoul (Note 1).

But lower rankings were not limited to high-income world urban areas. Mexico City and Sao Paulo, which were among the top 5 in 1990, fell to the bottom of the top 10. Kolkata fell from 7th to 19th, while Buenos Aires also fell, from 10th to 20th.
The Future
Generally, the cities located in high-income nations are being nudged out of the top rankings. By 2030, only Tokyo-Yokohama and Seoul, among high-income world cities, are likely to remain in the top 10. By that time, current projections indicate that Jakarta will have become the most populous. New York is likely to fall to 12th (Note 3). All of this is consistent with United Nations projections, which indicate that nearly all of the world’s population growth in future decades will be outside the high-income world.
Note 1: Demographia World Urban Areas was the first to identify the under-estimation of population in some of the world’s largest urban areas, by other sources. For example, Demographia’s early estimates of the Jakarta, Delhi, Manila, Seoul-Incheon and Kuala Lumpur urban area populations were far higher than reported by others at the time. Other sources have revised their estimates upward. The earlier, lower estimates of others were, in actuality, municipal estimates that did not sufficiently take into consideration the spread of urbanization beyond city or other geographical limits. Demographia’s larger population estimates were the result of examining actual satellite maps to determine the extent of individual built-up urban areas.
Note 2: Demographia World Urban Areas is in its 14th year of publication. It was established for the purpose of bringing some consistency to the subject of urban density, in hopes of replacing often grossly invalid anecdotal comparisons between cities. The built-up urban area is the only level at which there is sufficiency consistency and sufficient data to estimate the urban densities of the urban organism at anything approximating international standards.
There continues to be considerable confusion about the measurement of urban densities. The key is in comprehending the differences between urban areas and metropolitan areas. Built-up urban areas are continuously built-up development that excludes rural lands (Figure 6). Built-up urban areas are the city in its physical form, as opposed to metropolitan areas, which are the economic or functional cities (the labor and housing markets). These terms are defined by Cheshire, et al. of the London School of Economics (see: “People rather than places, ends rather than means: LSE economists on urban containment”).

Demographia World Urban Areas uses base population figures, derived from official census and estimates data, to develop basic year population estimates within the confines of built-up urban areas. These figures are then adjusted to account for population change forecasts, principally from the United Nations or the various national statistics bureaus for a 2018 estimate.
Note 3: Projections based on Demographia World Urban Areas 2019 estimates, using United Nations or other projected rates.
Wendell Cox is principal of Demographia, an international public policy and demographics firm. He is a Senior Fellow of the Center for Opportunity Urbanism (US), Senior Fellow for Housing Affordability and Municipal Policy for the Frontier Centre for Public Policy (Canada), and a member of the Board of Advisors of the Center for Demographics and Policy at Chapman University (California). He is co-author of the "Demographia International Housing Affordability Survey" and author of "Demographia World Urban Areas" and "War on the Dream: How Anti-Sprawl Policy Threatens the Quality of Life." He was appointed by Mayor Tom Bradley to three terms on the Los Angeles County Transportation Commission, where he served with the leading city and county leadership as the only non-elected member. Speaker of the House of Representatives appointed him to the Amtrak Reform Council. He served as a visiting professor at the Conservatoire National des Arts et Metiers, a national university in Paris.
Photograph: Cover, 15th Annual Demographia World Urban Areas (Parliament of Hungary, Budapest).


