
Daily commute times are ballooning in Australia's largest capital cities (metropolitan areas, called Greater Capital City Statistical Areas). This is a finding of the latest Household, Income and Labour Dynamics in Australia (HILDA) Survey. The HILDA Survey is conducted across the nation by the University of Melbourne. The HILDA Survey has been conducted annually since 2001 and is funded by the Australian federal Department of Social Services.
Since 2002, the HILDA Survey has been providing estimates of work trip commute travel time in Australia. The Hilda Survey also reports on the mainland state and federal capital cities and in the balance of their respective states, as well as for the entirety of Tasmania and the Northern Territory, without separate data for their capitals. This article summarizes commute data over the period as reported in the HILDA 2019 Statistical Report.
The National Data
In 2002, the first year for which comparable data was collected, the national average (mean) daily round trip travel time was 48.8 minutes (an average of 24.4 minutes in each direction). By 2017, the year on which the new HILDA Survey reports, the average commute had reached 59.9 minutes, a 22.7 percent increase over the 15 years.
The mean average, however, masks an even more significant overall increase in travel time, indicated by the median (middle point at which one half of commuters had longer travel times and one-half had shorter travel times). In 2002, the median round-trip commute time was 30 minutes, but increased 60 percent by 2017 to 48 minutes. This means that many people who had shorter commutes before have seen their daily travel increase more than the overall average.
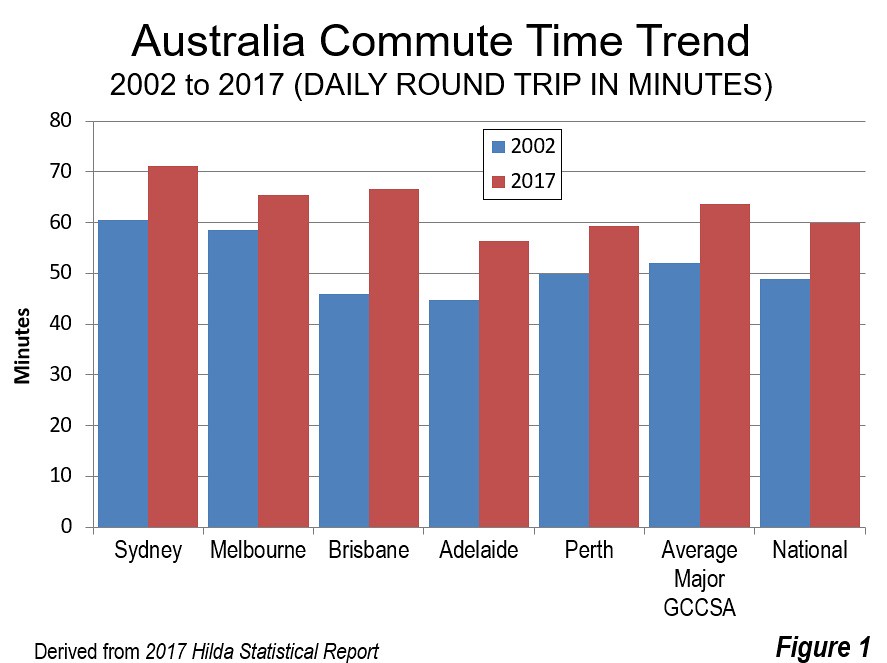
All major capital cities (over 1,000,000 population) experienced lengthening of travel times from 2002 to 2015, as indicated in the HILDA report (Figure 1):
• Brisbane, the third largest capital city (2.4 million), had a work trip travel time increase of 44.8 percent, from 46.0 minutes to 66.7 minutes (daily). Brisbane was the fastest growing capital city over the period (38.7 percent), with marginally greater growth than Perth and Melbourne, according to data from the Australian Bureau of Statistics.
• Adelaide, the fifth largest capital city (1.3 million), had a work trip travel time increase of 25.6 percent, from 44.8 to 56.3 minutes. Adelaide was by far the slowest growing among the major capital cities, adding to commutes by 14.7 percent. This is still a strong growth rate, at nearly one percent annually.
• Sydney, the largest capital city(5.1 million), had the longest daily commute, at an average of 71.1 minutes. This was up 17.4 percent from 60.6 minutes in 2002. Sydney grew 24.1 percent over the period.
• Perth, the fourth largest major capital city (2.0 million) had a daily commute of 59.3 minutes, up 18.7 percent from the 49.9 minutes of 2002. Perth has been Australia's fastest growing major capital city since World War II, but in the last 15 years fell behind Brisbane, at 37.7 percent.
• Melbourne, the second largest major capital city (4.9 million) had a daily commute of 65.4 percent, up 11.5 percent from 58.6 minutes. Melbourne had the smallest gain in commute times among the five capital cities. Melbourne has experienced resurgent population growth in the last 15 years, growing 38.6 percent and could be poised to challenge Sydney as the nation's largest capital city, after trailing for more than a century.
Comparison to the United States
The HILDA Study results can be compared with trends in the United States from 2005, the first year of annual journey to work reporting by the Census Bureau's American Community Survey. From 2005 to 2017, the average Australian commute time has increased 13.2 percent. By contrast, the national increase in the United States was just over one-half that, at 7.2 percent.
The average increase in commute time among the five major capital cities in Australia was 12.1 percent from 2005 to 2017. Brisbane had the largest increase, at 20.0 percent, while the smallest was in Adelaide at 4.8 percent. In both cities, the increases were better from 2005 than from 2002.
The Australia major capital city average is higher than that of all but four of the 53 major metropolitan areas in the United States from 2005 to 2017. Only San Jose (26.1 percent), San Francisco (21.6 percent), Seattle (14.4 percent) and Portland (13.5) had larger average commute times. Overall commute times increased 6.8 percent in the 53 US metropolitan areas (Figure 2). Grand Rapids had a decrease of 2.3 percent over the period, while fast growing Phoenix had no increase in commute times.

Traffic Congestion Likely to Worsen
Despite their impressive high-rise central business districts (CBD), employment is comparatively dispersed in the capital cities of Australia (see photograph above). For example, in Sydney, with the largest CBD in the nation, the Grattan Institute estimated that 78 percent of employment was outside both the CBD and the various large subcenters. In each of the other capital cities, employment outside the CBD and the subcenters was from nearly two-thirds to 79 percent.
Land use policy, specifically densification and urban containment (called urban consolidation in Australia) is playing a role. Tony Recsei, president of Sydney-based Save Our Suburbs, New South Wales told the Australian Financial Review that "High-density policies are a significant factor in longer journey times." He continued: "We pay a high price for policies that are ideologically driven instead of evidence based."
About 80 percent of capital city travel demand is handled by automobiles. Higher densities of people and necessarily cars will only worsen the congestion already straining streets and freeways. Mass transit's gains are modest, with a market share rising little more than one percentage point from 2000 to 2013. With roads increasingly congested and the traffic congestion naturally attendant to higher density, Australia's long-suffering commuters can anticipate more suffering ahead.
Wendell Cox is principal of Demographia, an international public policy and demographics firm. He is a Senior Fellow of the Center for Opportunity Urbanism (US), Senior Fellow for Housing Affordability and Municipal Policy for the Frontier Centre for Public Policy (Canada), and a member of the Board of Advisors of the Center for Demographics and Policy at Chapman University (California). He is co-author of the "Demographia International Housing Affordability Survey" and author of "Demographia World Urban Areas" and "War on the Dream: How Anti-Sprawl Policy Threatens the Quality of Life." He was appointed by Mayor Tom Bradley to three terms on the Los Angeles County Transportation Commission, where he served with the leading city and county leadership as the only non-elected member. Speaker of the House of Representatives appointed him to the Amtrak Reform Council. He served as a visiting professor at the Conservatoire National des Arts et Metiers, a national university in Paris.
Photograph: Brisbane central business district (CBD), by author


