
Big cities are the engines of the modern economy. They offer workers a range of opportunities — and employers a range of workers, customers, and infrastructure — that smaller places generally can’t match. But when it comes to what many job seekers care about most, smaller cities often are best. In particular, for most jobs, salaries are higher in smaller places after accounting for the cost of living.
Brownsville-Harlingen, TX, Fort Smith, AR-OK, and Huntington-Ashland, WV-KY-OH offer the highest adjusted salaries. Among larger metros, Birmingham, Memphis, and Cincinnati come out on top. For nearly every metro, there are a few other places that offer a similar mix of jobs, but have higher adjusted salaries. (Our interactive map, below, shows where to find those places.)
For some jobs though, smaller isn’t necessarily better. Many tech and other high-paying occupations offer higher adjusted salaries in larger metros — and tech salaries are highest in Boston and Washington, DC, two big tech hubs. As always, the right city is ultimately a personal choice — it depends on what job you’re in and whether you value a higher adjusted salary above all else.
Where adjusted salaries are highest
Before adjusting for cost of living, America’s highest salaries are in San Jose, San Francisco, and several other California metros. To see this, we calculated the average salary for all Indeed job postings between April 2018 and April 2019 that included annual salary information. We factored in differences in the local job mix, comparing pay across places for the same job titles.
But these high-salary places like the Bay Area tend to have the country’s highest costs of living — especially for housing, but for other goods and services too. In these high-salary places, it’s money in, money out.
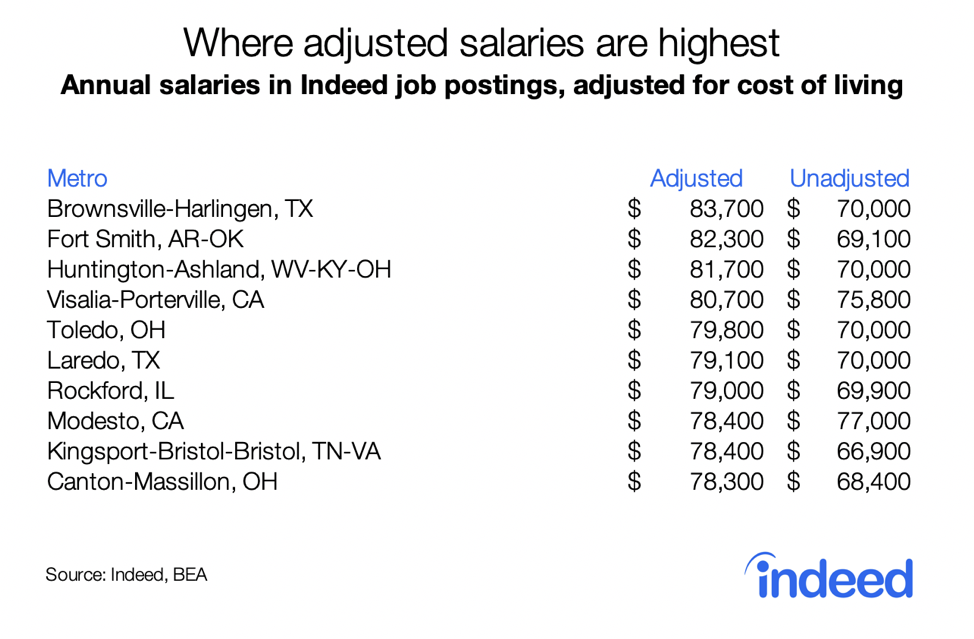
When we adjust for cost of living, the highest-salary metros look totally different. Among the 185 US metropolitan areas with at least 250,000 people, adjusted salaries are highest in Brownsville-Harlingen, TX, Fort Smith, AR-OK, and Huntington-Ashland, WV-KY-OH. All ten of the highest-salary metros are small and mid-size markets — none has more than a million people. Most are in the center of the country, and the only two in an expensive state — Visalia-Porterville, CA, and Modesto, CA — are in California’s Central Valley, worlds away from the state’s pricey coast.
Adjusted salaries are lowest in Honolulu, Myrtle Beach, SC-NC, Miami, and New York and several nearby tri-state metros. Many of these low-paying metros offer desirable amenities — like beaches, good weather, or cultural offerings. For these attractions, many people are willing to accept lower wages or pay more for housing. The ten metros with the lowest adjusted salaries are all in coastal states, often right on the water.
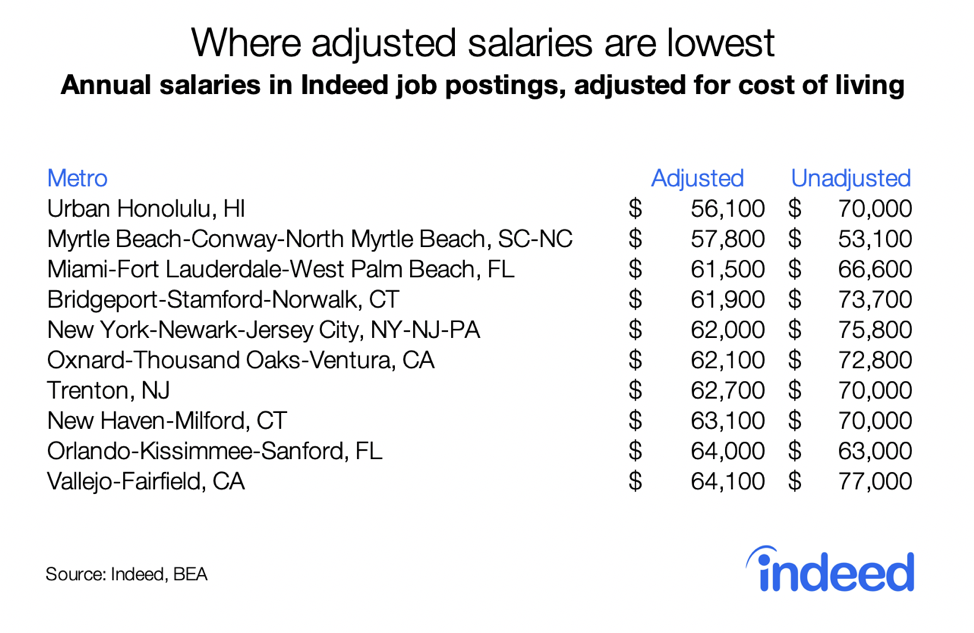
Differences in adjusted salaries can be big. The same job pays 49% more on average in Brownsville, TX than in Honolulu, after adjusting for cost of living — and 42% more in Fort Smith than in Myrtle Beach. But few people make moves between radically different metros if it means major changes in career or lifestyle. In fact, the mix of jobs on Indeed is pretty different in Brownsville than Honolulu. Still, there can be big gaps in adjusted salaries between metros with similar job mixes. Adjusted salaries are 15% higher in Atlanta than Miami, 22% higher in Modesto than Vallejo, CA, and 31% higher in Sacramento than Honolulu. Check out our interactive map to see how adjusted salaries compare in metros with similar job mixes to your hometown — or between any pair of metros.
The small-city advantage for salaries
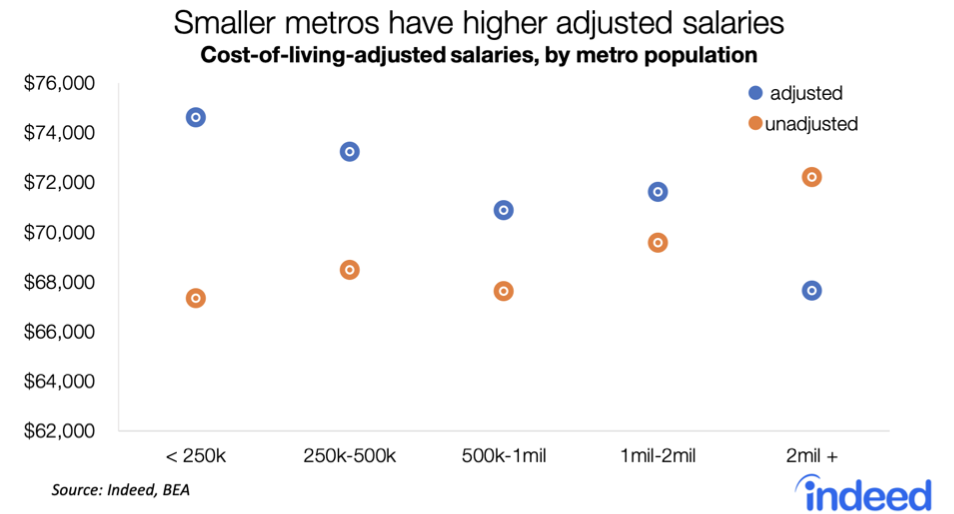
The ten metros with the highest adjusted salaries are all small and mid-size metros. These aren’t just odd exceptions — it’s a general pattern. Unadjusted salaries are 7% higher in metros with at least two million people than in metros with fewer than 250,000 people — but salaries after adjusting for living costs are 9% lower.
Adjusted salaries stand out as an advantage of smaller labor markets, but on most other job measures, larger places are ahead. Bigger metros have faster job growth and lower unemployment. They’re also better positioned for the future, with more highly educated residents and a mix of occupations more likely to grow and less likely to be threatened by automation.
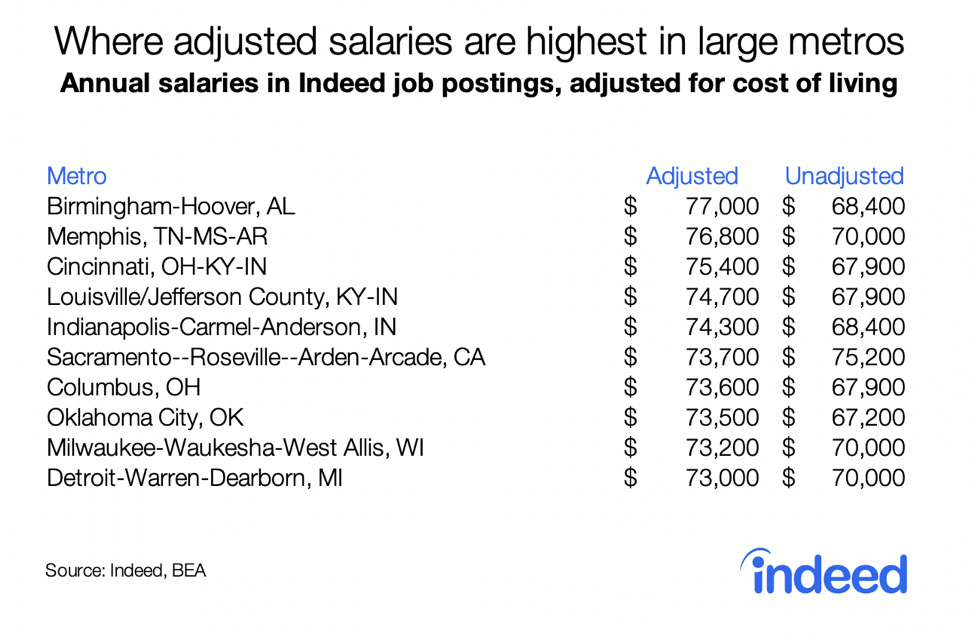
Despite the overall pattern, you can find larger metros where adjusted salaries are relatively high. Birmingham, Memphis, and Cincinnati have the highest adjusted salaries among million-person metros. Only one of these top metros — Sacramento — is in a coastal state. And none of these metros is huge. The five-million-person metro with the highest adjusted salaries is Atlanta, at $70,600.
Tech hubs offer higher tech salaries
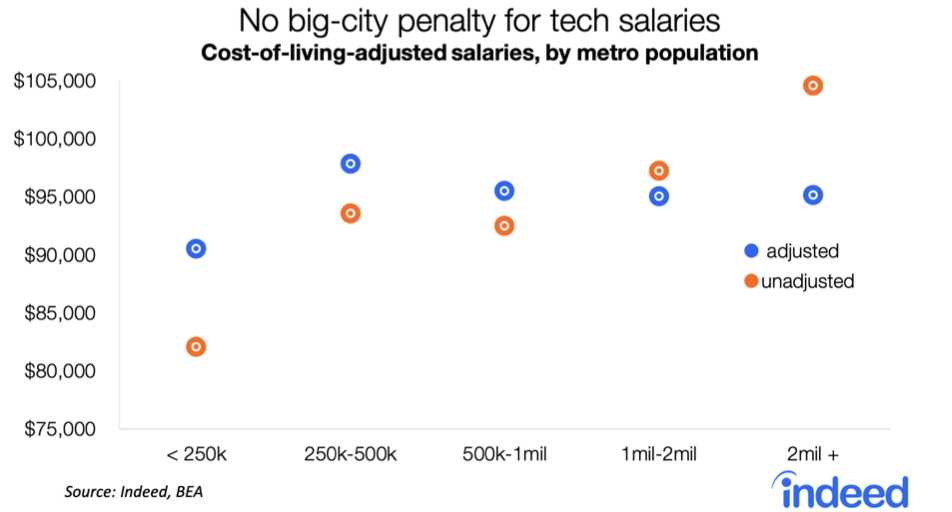
The small-city advantage holds for adjusted salaries overall and for most individual occupations. It’s especially strong in sales, transportation, and healthcare. In these sectors, adjusted salaries are notably higher in smaller metros than in larger metros. But two other sectors are exceptions. Many job titles in finance and tech — both high-paying fields to begin with — pay more in larger metros than smaller ones even after accounting for the cost of living. Let’s take a closer look at tech.
Before adjusting for living costs, typical technology salaries are 27% higher in two-million-plus metros than metros with fewer than 250,000 people. Even after adjusting for those costs, tech salaries are still 5% higher in the largest metros than in the smallest ones. And tech salaries in metros between 250,000 and 500,000 people are higher yet — and nearly the same across mid-size, large, and very large metros. Therefore, there’s no clear smaller-place premium for tech jobs as there is for jobs overall. And we’re comparing salaries across metros for the same occupations — we’re not comparing well-paid machine learning engineers in big cities with online help technicians in smaller places.
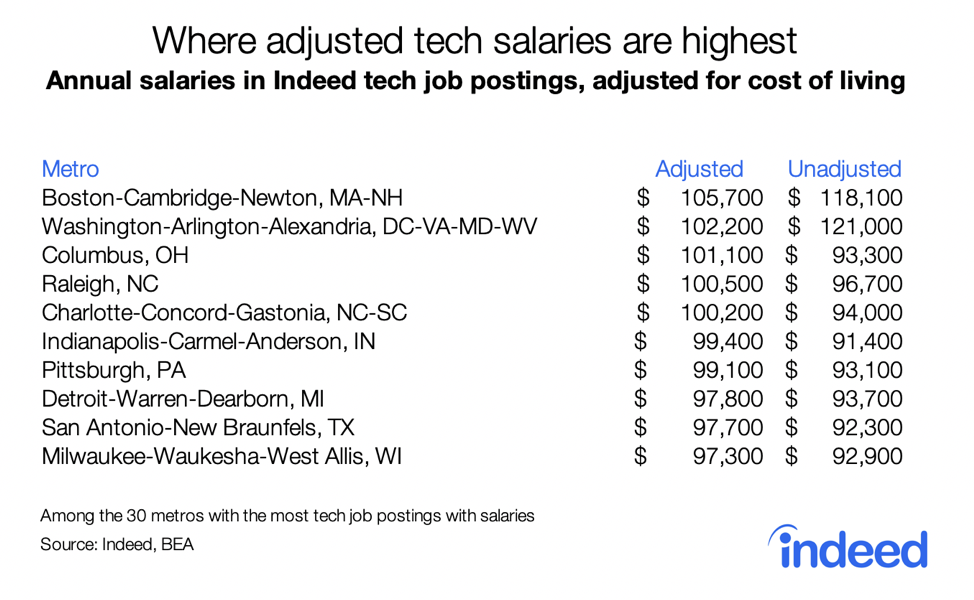
Where does tech pay the most? Adjusted for cost of living, tech salaries are highest in Boston, Washington, DC, and Columbus among the thirty metros with the most tech job postings showing salaries. Tech salaries tend to be higher where tech jobs cluster. Three of the eight big tech hubs are among the five where salaries are highest. Adjusted tech salaries are somewhat lower in the Bay Area, Seattle, and Austin, but the broad pattern is that tech jobs pay better where tech is more concentrated.
What do the salary patterns in different-size metros reveal about local labor markets?
First, local salary differences clearly vary by occupation. The place where accountants earn the most may not offer the highest salary for salespeople, nurses, or software engineers. Some tech workers in particular will find higher salaries in different cities than the rest of us.
Second, occupations that pay more nationally — like many jobs in tech — tend to pay even more in large metros. By contrast, lower-paying occupations tend to offer more in smaller metros, adjusted for living costs. Put another way, in large metros, there’s a bigger gap between salaries of high-paying versus low-paying occupations than in smaller metros. That’s one reason why income inequality is more extreme in larger metros than in smaller metros.
Third, larger cities might not be the best deal for most job seekers, but they’re still where employers want to hire. The math is different for workers and employers. Workers care about the local cost of living and should compare adjusted salaries. But employers write paychecks on unadjusted salaries. The fact that unadjusted salaries are higher in bigger cities means that employers pay a premium to hire there — 7% for all jobs on average and 27% for tech jobs. If employers could find the workers they need and have them be as economically productive in smaller places, they wouldn’t pay those higher big-city salaries. Instead, they would hire in cheaper places. For some jobs, that’s exactly what happens — those jobs get priced out of expensive metros. But for most jobs, employers are willing to pay more to hire in big cities, even though most jobs offer workers a better deal in smaller ones.
Methodology
Salary data are from all job postings with annual salaries on Indeed between April 2018 and April 2019. Unadjusted average salaries are based on weighted median deviations across occupations, which accounts for the different mix of job titles across metros in order to make an apples-to-apples comparison of unadjusted salaries.
Local cost-of-living data are from the U.S. Bureau of Economic Analysis regional price parities for 2017, released May 2019. These cost-of-living data reflect local differences in the price of housing, other services, and physical goods.
All 185 U.S. metropolitan areas with at least 250,000 people are included in the rankings.
Unadjusted and adjusted salary data in this blog post should not be compared with salary data from previous blog posts on this topic. The occupational composition of job postings with annual salaries changes over time. Our methodology adjusts for differences in occupational composition across metros at a point in time, but not for differences in occupational composition over time.
This piece originally appeared on Indeed Hiring Lab.
Jed Kolko is Chief Economist at the Indeed Hiring Lab. Previously he was Chief Economist and VP of Analytics at Trulia, the online real estate marketplace. He has also led research teams at the Public Policy Institute of California and at Forrester Research. Jed specializes in using large-scale proprietary and publicly available datasets to uncover insights about labor markets, the future of work, demographics, housing markets, and urban trends. He earned his B.A. in social studies and his Ph.D. in economics at Harvard University.


