
Austin is one of the fastest-growing cities in America, and the city of Austin and Austin’s transit agency, Capital Metro, have a plan for dealing with all of the traffic that will be generated by that growth: assume that a third of the people who now drive alone to work will switch to transit, bicycling, walking, or telecommuting by 2039. That’s right up there with planning for dinner by assuming that food will magically appear on the table the same way it does in Hogwarts.
Click image to download a 4-page PDF of this policy brief.
Austin planners say that 74 percent of Austin workers drive alone to their jobs. In this, they are already behind the times, as the 2018 American Community Survey found that 75.4 percent of Austin workers drove alone (that’s for the city of Austin; the drive-alone share in the the Austin urban area was 77.0 percent). The 2018 survey was released only a month before Austin’s latest planning document, but even the 2017 survey found that 75 percent of Austin workers drove alone. You have to go back to the 2016 survey to find 74 percent drive-alones. So while Austin planners are assuming they can reduce driving alone from 74 to 50 percent, it is actually moving in the other direction.
Planners also claim that 11 percent of Austin workers carpool to work, an amount they hope to maintain through 2039. They are going to have trouble doing that as carpooling, in fact, only accounted for 8.0 percent of Austin workers in 2018.
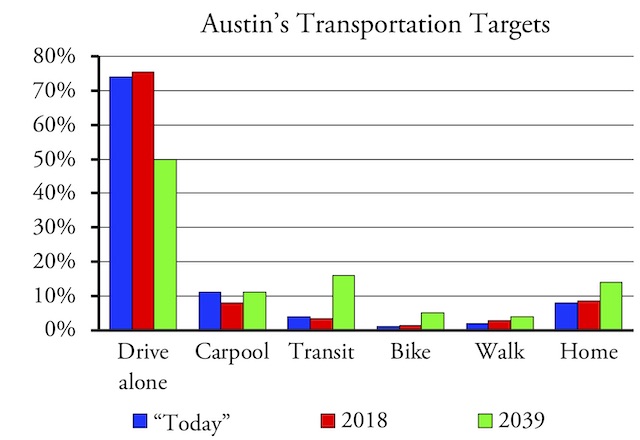
“Today” is what Austin planners say today’s commute shares are, which appears to be based on 2016 numbers. 2018 shows commute shares from the 2018 American Community Survey while 2039 shows Austin’s targets.
Planners hope to increase telecommuting from its current 8 percent (which is accurate) to 14 percent. That could be difficult as they have no policy tools that can influence telecommuting.
Planners also hope to increase walking and bicycling from their current 2 and 1 percent to 4 and 5 percent. Walking to work is almost always greater than cycling to work, so it’s difficult to see how they plan to magic cycling to be greater than walking. This is important because cycling trips are longer than walking trips and so have more of a potential impact on driving.
Finally, planners want to increase transit from 4 to 16 percent. In fact, transit carried just 3.24 percent of workers to their jobs in 2018, down from 3.62 percent in 2016. Changing from 4 to 16 percent is a an almost impossible 300 percent increase; changing from 3.24 to 16 is an even more formidable 394 percent increase. Again, reality is moving in the opposite direction from planners’ goals.
When reading this plan, my first question was, “has anyone ever been able to reduce driving alone to work from roughly 75 to 50 percent?” And the second question was, “has anyone ever been able to increase transit’s share by 300 to 390 percent?” Of course, I had similar questions about the projected quintupling of cycling and other parts of the plan, but those were the two big ones. We can answer these questions by looking at changes in commuting in various cities and urban areas between 2000 and 2018, which is approximately the amount of time in Austin’s planning period.
Austin’s Plan
Austin planners offer a list of strategies and projects that are supposed to produce major changes in transportation habits. For the most part, the strategies are similar to those used in many other cities.
For example, the carpooling strategies include Commute Solutions, a web site that allows people to find potential carpoolers; Smart Trips, another web site; Movability, a web site for employers; vanpooling; and similar programs. All of these programs assume that people are actively looking for carpooling partners. The reality is that the vast majority of carpooling is “fampooling,” that is, family members riding together to work. Carpooling has declined because family sizes have declined, so there are fewer opportunities for fampooling.
Austin’s “active transportation” (meaning walking and cycling) strategies include new sidewalks, pedestrian and bike trails, a Safe Route to School program, and similar programs. Again, communities all over the nation are using similar programs. Safe Route to Schools, for example, is a federal grant program that has given money to cities all over the country.
Austin’s transit strategies include adjusting traffic signals to give priority to transit vehicles, transit incentives including discounted transit passes and a frequent-rider program, new park-and-ride stations, and of course Project Connect, Capital Metro’s dream of high-cost, “high-capacity” transit routes. (The term “high-capacity” is in quotes because some modes that Capital Metro calls “high-capacity,” such as light rail, are in fact low-capacity transit.) Again, many other cities have used signal priority systems, discounted transit fares, and high-cost transit systems to attract riders.
To see how well these programs have worked, I looked at journey-to-work data published by the Census Bureau. From 1960 to 2000, the decennial census asked a sampling of people how they got to work. Since 2005, the Census Bureau has done an annual American Community Survey asking people, among other things, how they get to work. The most recent American Community Survey data are from 2018.
Since Austin is proposing to change people’s transportation habits by 2039, or 20 years in the future, I compared data for 2000 with 2018, which is close to 20 years of change. I looked at the data for 262 of the nation’s largest cities and 208 of the nation’s largest urban areas and posted a spreadsheet with these data so you can see what happened in your city or urban area.
I first looked to see which areas saw the biggest declines in the share of workers driving alone to work and/or the biggest increases in the share taking transit to work. Then I tried to determine what caused those changes and whether Austin’s plans are likely to produce similar results.
Reducing Drive-Alone Share
Between 2000 and 2018, the share of workers driving alone to work increased in 53 percent of major cities and 54 percent of urban areas. In most of the places where driving alone declined, it fell by less than 3 percentage points. Among central cities such as Austin, driving alone fell by more than 9 percentage points in only two: Seattle, where it fell by 12 percentage points, and San Francisco, where it fell by 10. It also declined by 19 percentage points in Seattle’s suburb of Bellevue and by 12 percentage points in San Francisco suburbs San Mateo and Mountain View.
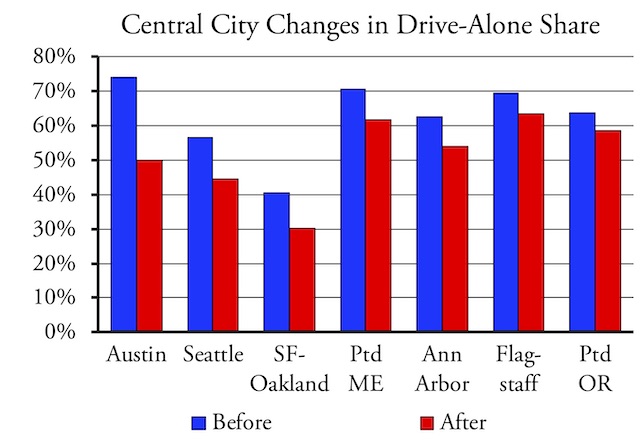
In this and the next two charts, “before” is 2016 for Austin and 2000 for the other central cities; “after” is Austin’s 2039 target and 2018 for the other central cities. The other cities shown are the ones that saw the greatest decline of driving alone between 2000 and 2018.
Among major urban areas, driving alone declined by 10 percentage points in Livermore (which is really a suburb of San Francisco but is counted as a separate urban area by the Census Bureau), 6 in Seattle, Concord (another suburb of San Francisco), Danbury, and Ann Arbor, and 5 in Flagstaff, San Francisco-Oakland, Rochester, Albany, and Boston.
The fact that driving alone fell by much more in cities such as Seattle and San Francisco than in their urban areas suggests that a sorting process is taking place, where people who prefer not to drive move to the cities while people who prefer to drive are sorted into the suburbs. The result is that city programs that attempt to reducing driving may have a negligible effect when the urban areas are considered as a whole.
In Seattle, the main factor changing commuting habits has been the tremendous growth of jobs in the downtown area, a result of Amazon, Microsoft, and other high-tech companies building new downtown high-rise office buildings. According to the Downtown Seattle Association, downtown Seattle had 244,000 jobs in 2000 and 314,000 in 2018. Today, Seattle may be the only major city in American that has more than half of its jobs downtown. Since hub-and-spoke transit systems work particularly well for downtown workers, increasing downtown jobs increases transit’s share of commuting. Downtown San Francisco also has the fourth-largest concentration of jobs in the United States.
Only about 20 percent of jobs in the city of Austin (and less than 10 percent in the Austin urban area) are located in downtown Austin. Thus, Austin would have a difficult time replicating Seattle’s results.
Austin’s plan for reducing the share of people driving alone to work involves reducing parking and road diets (converting auto lanes to bike or bus lanes). They call this “managing demand” as in “managing parking supply to reduce demand” or “manage congestion by managing demand.” But creating a shortage of something doesn’t change demand; all it does is create frustrated travelers. Many cities and regions have tried similar programs, yet no city or urban area has been able to reduce driving-alone’s share of travel by 24 to 26 percentage points in the last eighteen years, as Austin hopes to do.
Increasing Transit’s Share
Between 2000 and 2018, transit’s share of commuting grew in 43 percent of the nation’s major cities and 37 percent of the nation’s major urban areas. Among central cities, the biggest increases in transit’s share of commuting took place in Albany (4.6 percentage points), Seattle (4.0), New York (3.5) and San Francisco (3.3).
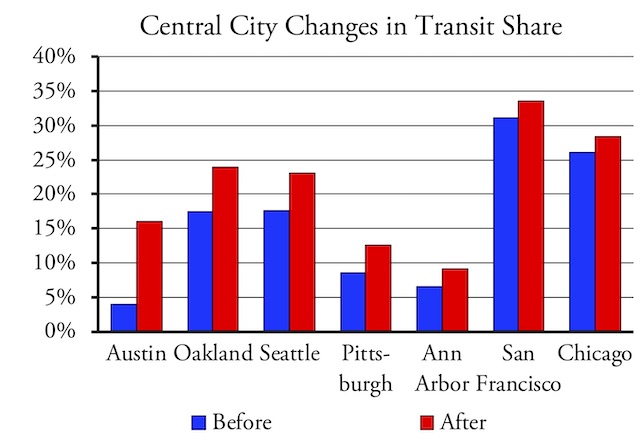
As with the previous chart, the central cities shown saw the greatest changes in transit’s share between 2000 and 2018, yet none came close to Austin’s target.
On the other hand, transit’s share declined in many cities and urban areas that have invested heavily in transit improvements. Transit’s share declined by 5.0 percentage points in Atlanta, 2.6 in Denver, 2.1 in Houston, and 1.6 in Dallas. Transit’s share also declined in each of these urban areas.
Among cities where transit’s share was about 3.2 percent in 2000, which is what Austin’s was in 2018, only one — Kalamazoo, Michigan — saw a large increase in transit’s share, and that was only 50 percent more than what it was in 2000. Phoenix and Charlotte both had 3.2 percent shares in 2000, invested heavily in light rail, and saw transit’s share nonetheless decline by 2018.
Austin’s dreams are also contradicted by recent ridership trends. Austin, Dallas-Ft. Worth, Houston, and San Antonio are some of the fastest-growing urban areas in the United States, having collectively gained 50 percent more people from 2000 to 2018. Yet the transit systems in all four urban areas have lost 4 to 22 percent of their riders. Per capita ridership has fallen by 33 to 58 percent, with Austin transit suffering the largest losses and per capita losses. Thus, Austin’s assumption that it can increase transit’s share by more than 12 percentage points, or by 394 percent, in the next 20 years appears highly unrealistic.
Maintaining Carpooling
Many cities have carpooling programs like the ones planned or used by Austin, yet since 2000, carpooling has declined in 92 percent of major American cities and 90 percent of major urban areas. As noted, most carpooling is fampooling, so unless family sizes increase, carpooling is likely to decline.
Increasing Walking and Cycling
A slight majority of cities and urban areas saw cycling’s share of commuting increase, but only a few — 5 percent of cities and 33 percent of urban areas — saw walking increase. Even where increases took place, they tended to be small.
Among central cities, cycling grew by 3.6 percentage points (which is close to Austin’s target) in Portland, 3.1 in Washington, 2.4 in New Orleans, 2.2 in San Francisco, 1.9 in Seattle, 1.6 in Denver, and 1.5 in Minneapolis. In other central cities and most suburbs it grew by less than 1.5 percentage points. Walking increased by 6.2 percentage points in the city of Boston; 2.9 in Portland, Maine; 2.3 in Washington; 1.9 in San Francisco; 1.6 in New York; and 1.0 in Seattle.
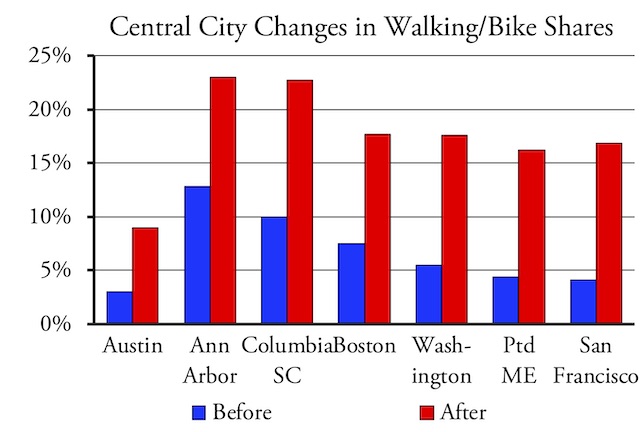
When taken together, Austin’s goals for increasing walking and cycling together are the one set of targets that appear to be attainable.
Among major urban areas, cycling increased by 1.9 percentage points in Santa Barbara, 1.4 in Portland and Anchorage, 1.0 in Madison, 0.9 in San Jose, and 0.8 in New Orleans and San Francisco-Oakland. Walking increased by 4.0 percentage points in Flagstaff; 2.8 in Santa Cruz; 1.6 in Portland Maine; 1.4 in Ft. Collins; 1.1 in Seattle; and 1.0 in Boston.
Austin’s goals for walking and cycling appear to be the only ones that seem attainable, yet even they will be difficult. Moreover, a lot of the increase in walking and cycling in various cities seems to be coming out of transit’s share, not the drive-alone share. Notice from the first chart that Austin itself has seen an increase in walking and cycling at the expense of transit, while drive-alone’s share has also increased.
Austin’s numbers are also unrealistic in that planners assume they can increase cycling’s share of travel to be greater than walking’s share. This is significant since, as previously noted, cycling trips tend to be longer than walking trips and so are more likely to have an effect on total driving. Nationwide, cycling’s share of commuting exceeds that of walking in less than 4 percent of major cities and less than 3 percent of major urban areas.
Increasing Telecommuting
Between 2000 and 2018, people working at home grew in 95 percent of major cities and 98 percent of major urban areas. Most of this growth took place without any city or regional policies promoting it, and the most growth appears to have taken place in high-tech cities and urban areas such as the cities of Berkeley and Palo Alto and the Raleigh and Austin urban areas.
While working at home may increase further, Austin’s assumption that it can increase working at home by 6 percentage points to 14 percent appears unrealistic. Only two suburbs — Highlands Ranch, Colorado and Scottsdale, Arizona — had that high a share of people working at home in 2018. The highest shares in any central cities are Portland and Atlanta, each of which are under 10 percent.
Realistically, only certain jobs are amenable to working at home. Most working-class jobs must be done either in factories or on site. Many office jobs, such as jobs in the banking, insurance, and similar sectors, require regular face-to-face contact. Most education, health care, retail, and wholesale jobs must also be in non-residential locations. The number of people working at home may grow, but the amount of that growth is beyond Austin’s control.
Conclusions
Planners have developed two main approaches to transportation. One is to estimate how people will travel and then provide and maintain the infrastructure to allow them to do so as efficiently and safely as possible. The other is to imagine how you wish people would travel and then provide the infrastructure assuming that to happen. The latter method is likely to lead to misallocation of capital resources, increased congestion, and increased costs to travelers.
Austin’s plan is firmly based on this second approach. The city’s targets of reducing driving alone by a third, maintaining carpooling at an already too-high number, and increasing transit by 394 percent are completely unrealistic. No American city has achieved similar results in the past two decades and none are likely to come close in the next two decades.
As discussed in a previous policy brief, one of the biggest factors in commute patterns is the number of downtown jobs. Many people think population density is a major factor, but among urban areas the correlation between urban population densities and the share of commuters who use transit is only about 0.4. Meanwhile, the correlation between the number of downtown jobs and the share of commuters who use transit is nearly 0.9.
So it is not surprising that the cities that have seen the biggest reductions in driving alone and biggest increases in transit commuting — Seattle and San Francisco — have hundreds of thousands more downtown jobs than Austin. Even they haven’t seen changes as great as Austin is fantasizing for 2039. In short, Austin needs to go back to the drawing board and develop a plan that is based on how people actually will travel in 2039 and not one based on how planners wish they would travel.
This article previously appeared on The AntiPlanner.


