
The US total fertility rate continues to fall, according to 2018 final birth data from the Centers for Disease Control (CDC). The total fertility rate (TFR) is “the expected number of lifetime births per woman women given current birth rates by age.” Generally, the TFR needs to be at least 2.1 for a society to maintain its population.
Total Fertility Rates: National and by Ethnicity
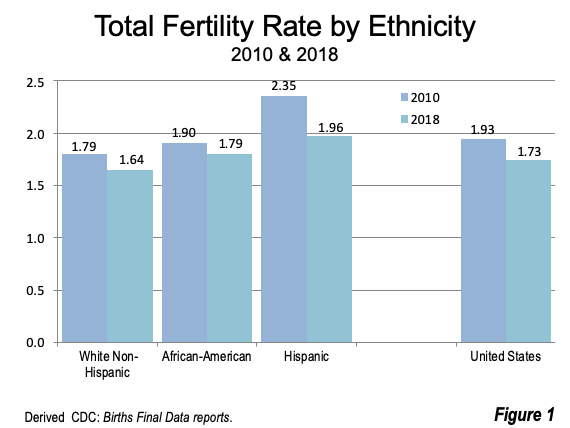
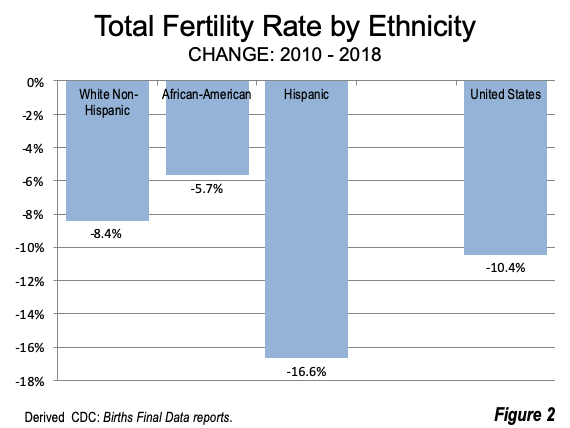
The US was 2.1 last reached in 2007, after having recovered from a 1.98 in 1995 . By 2018 the US TFR dropped to 1.73, a 10.4% drop from the 2010 rate of 1.93. The largest drop was among Hispanics, from 2.35 to 1.96, a decline of 16.6%. The White Non-Hispanic rate dropped 8.4% from 1.79 to 1.64. The African-American TFR dropped the least, by 5.7% from 1.90 in 2010 to 1.68 in 2018 (Figures 1 and 2). The 2018 Asian TFR was 1.65. Separate data for Asians was not reported in 2010.
Total Fertility Rates by State
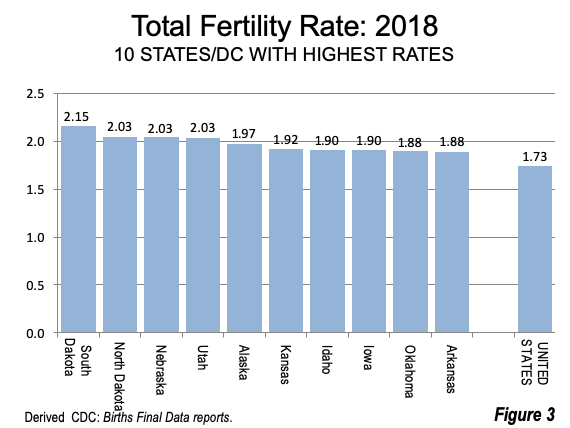
The highest TFR in 2018 by state (or DC) was in North Dakota, at 2.15. North Dakota’s TFR was just above the replacement rate of 2.1, a feat not equaled by any other state. Neighboring South Dakota, South Dakota’s southern neighbor, as well as Nebraska and Utah all had TFRs of 2.03. Alaska’s TFR was 1.97. All of the 10 states with the highest TFRs were either in the Heartland, which stretches from states west of the Appalachian crest to the the Rocky Mountain states (the eastern borders of New Mexico, Colorado, Wyoming and Montana far away from the large coastal population centers. The next five highest fertility rates were in Kansas, Idaho, Iowa, Oklahoma and Arkansas(Figure 3).
Total Fertility Rates by State
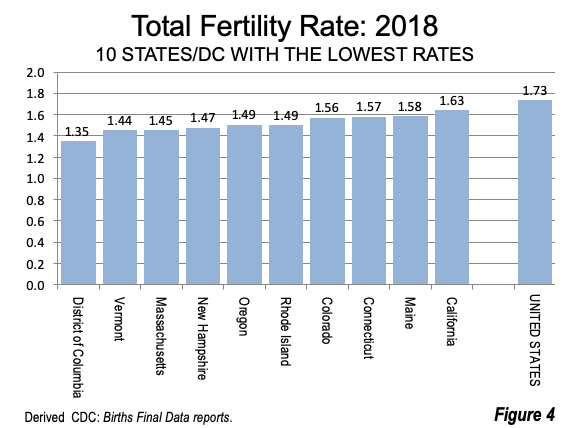
The lowest TFRs were concentrated in the Northeast Corridor, The District of Columbia (Washington) had the lowest TFR at 1.35. The District of Columbia’s TFR is nearly 10% below that of Japan (1.48), according to World Population Review. Japan has long been considered to have one of the lowest fertility rates in the world.
Vermont, Massachusetts, New Hampshire and Rhode Island also had TFRs under 1.5. Oregon also had a TFR below 1.5. Each of these states had a rate below or near as low as Japan. Colorado, Connecticut, Maine and California rounded out the least fertile 10 (Figure 4).
Change in Total Fertility Rates by State
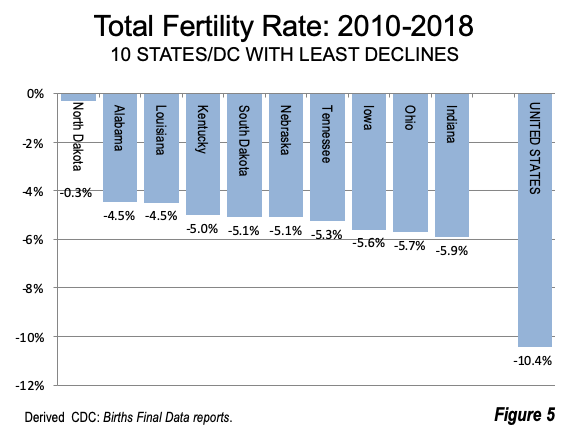
All states and DC experienced declines in their TFRs between 2010 and 2018. North Dakota had by far the least decline, at 0.3%. The decline in Alabama, Louisiana and Kentucky was less than 5%. The balance of the ten least declining states fell by less than 6% (South Dakota, Nebraska, Tennessee, Iowa, Ohio and Indiana). All of these states are in the Heartland. Indeed 17 of the states with the least declining TFRs were in the Heartland, including Mississippi, Arkansas, Missouri, West Virginia. Minnesota, Michigan and Wisconsin. Only nearly all suburban New Jersey managed to break into this group, with the 13th highest TFR (Figure 5).
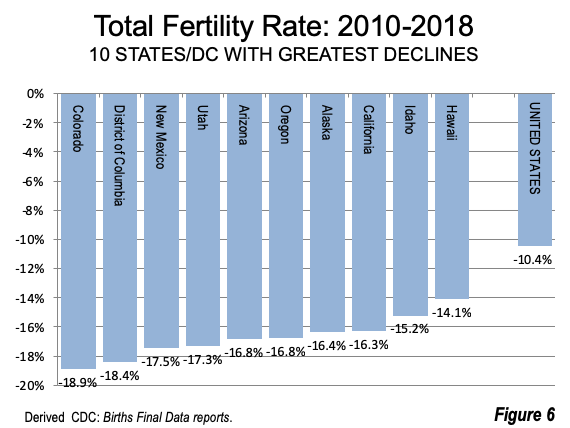
Nine of the ten largest declines were in the West. The largest decline was in Colorado, at 18.9%. The District of Columbia is the only non-Western jurisdiction among the largest declines, at 18.4%. New Mexico, Utah, Arizona, Oregon, Alaska, California and Idaho all had declines of more than 15%. Hawaii had the 10th largest decline (Figure 6).
A Tale of Two Nations
Fertility continues to decline across the United States, which generally duplicates the trend around the world. The exceptions are nations where fertility has already fallen far below replacement rates, like Portugal, Poland and Moldova, with TFRs of approximately 1.25. according to World Population Review. Nonetheless, there are huge differences in fertility between the states. North Dakota has a TFR nearly 50% greater than that of Vermont, Massachusetts, Oregon and Rhode Island. And, the middle of the country is less infertile than the Pacific Coast and the Northeast Corridor.
These data could be an indication of the much discussed “cultural divide” in the United States between the coasts and the Heartland. The numbers suggest that the middle of the country being much more family oriented. . America’s demographic future seems likely to be increasingly in the Heartland and Intermountain West, because of its higher fertility.
Photo credit: Stork Nest (Spain) via Wikimedia under CC 3.0 License.
Wendell Cox is principal of Demographia, an international public policy and demographics firm. He is a Senior Fellow of the Center for Opportunity Urbanism (US), Senior Fellow for Housing Affordability and Municipal Policy for the Frontier Centre for Public Policy (Canada), and a member of the Board of Advisors of the Center for Demographics and Policy at Chapman University (California). He is co-author of the "Demographia International Housing Affordability Survey" and author of "Demographia World Urban Areas" and "War on the Dream: How Anti-Sprawl Policy Threatens the Quality of Life." He was appointed by Mayor Tom Bradley to three terms on the Los Angeles County Transportation Commission, where he served with the leading city and county leadership as the only non-elected member. Speaker of the House of Representatives appointed him to the Amtrak Reform Council. He served as a visiting professor at the Conservatoire National des Arts et Metiers, a national university in Paris.


