
Demographia World Urban Areas contains population, land area and population density for the nearly 1,000 identified built-up urban areas in the world with 500,000 or more population. The total population of these urban areas is estimated at 2.36 billion, representing 52 percent of the world urban population as estimated by the United Nations.
The 19th annual Demographia World Urban Areas has just been posted. Demographia World Urban Areas contains population, land area and population density for the nearly 1,000 identified built-up urban areas in the world with 500,000 or more population. The total population of these urban areas is estimated at 2.36 billion. In 2002, Demographia World Urban Areas accounted for 52 percent of the world urban population, as estimated by the United Nations.
Demographia World Urban Areas is the only annually published comprehensive inventory of population, corresponding land area and population density for identified urban areas with more than 500,000 population.
Highlights of the 2023 Report
There are 44 megacities (urban areas of at least 10 million population) and 100 urban areas with at least 5,000,000 residents, up from 97 last year.
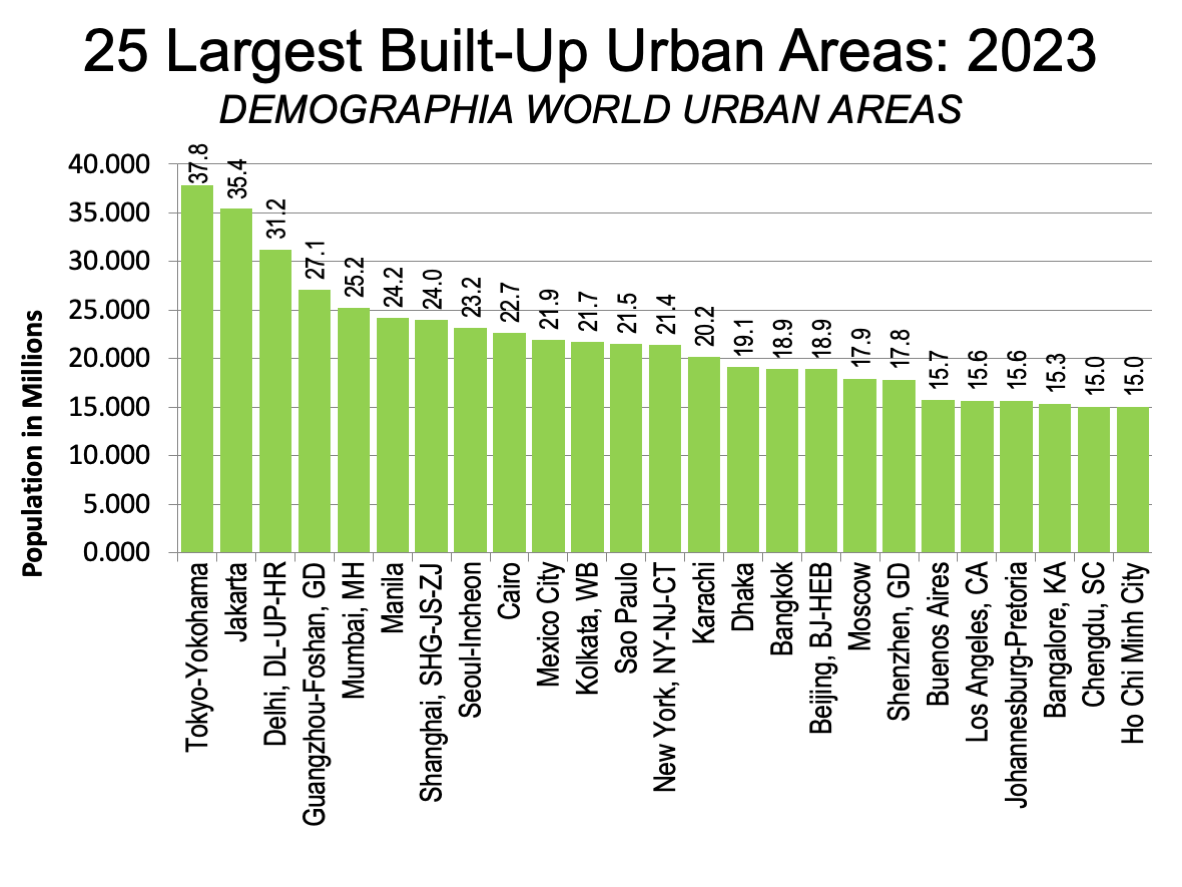
The difference in population between Tokyo-Yokohama and Jakarta, the world’s largest and second largest built-up urban areas narrowed markedly, as base populations from 2020 were lower than projected in Tokyo-Yokohama (now estimated at 37.8 million) and higher in Jakarta (35.4 million). Tokyo-Yokohama has a population 2.4 million greater than Jakarta. Jakarta extended its lead over third ranked Delhi (31.2 million) to 4.0 million, and Delhi’s lead over fourth ranked Guangzhou-Foshan (27.1 million) was 4.1 million.
Guangzhou-Foshan is now China’s leading built-up urban area, as a result of a substantial population increase in the second half of the 2010s and population controls in Shanghai (24.0 million), which had been China’s largest urban area for decades. Mumbai (25.2 million), which had been predicted to become the world’s largest urban area a decade or so ago, is now estimated to have six million fewer residents than Delhi and seems unlikely to ever occupy the top spot.
Seoul-Incheon is only the second high-income urban area in the most populous ten, ranking 8th with 23.2 million residents. Fast growing Cairo ranks 9th, with 22.9 million residents, while Mexico City is the 10th largest, at 21.9 million residents.
The largest built-up urban areas are illustrated in Figure 1.
Overall Summary
The report includes a summary of urbanization by world region, with specific data for specific geographies (Schedule 1). Asia commands 57% of the reported built-up urban area population. East Asia represents 26%, with China accounting for 20%.
The built-up urban areas of South Asia are 16% of the total. Nearly 12% is in India, a considerable smaller number than China, despite the fact that India’s population now exceeds that of China.
Southeast Asia has 8% of the built-up urban area population, with 3.2% in Indonesia. Western Asia has 7% of the population, while Central Asia has less than 1%.
Outside Asia, Africa has 13% of the reported built-up urban area population, with Nigeria having the largest share, at 2%.
North America (which includes Canada, the United States, Mexico, Central America, and the Caribbean) has 12% of the population, dominated by the United States, with 8% and Mexico with 2%.
Europe has 9% of the population, with 5% in the European Union.
South America has 8% of the population, dominated by Brazil, with 4%.
Like Central Asia, Oceania (Australia and New Zeeland) accounts for less than 1% of the total.
The highest urban population densities are in Bangladesh (62,000), Colombia (37,000) the Democratic Republic of the Congo and Pakistan (36,000).
Built-Up Urban Areas: Not Metropolitan areas nor Municipalities
Demographia World Urban Areas was established to offer consistency, especially in urban density analysis, in hopes of replacing anecdotal comparisons between cities that are often invalid. The built-up urban area is the only level with sufficient data to estimate the densities of the urban organism at anything approximating consistency.
Unlike other regularly produced lists, Demographia World Urban Areas applies a generally consistent definition to built-up urban areas.1 Built-up urban area data is reported without regard to political boundaries whether associated with metropolitan areas, sub-national jurisdictions, or municipalities (Figure 2).
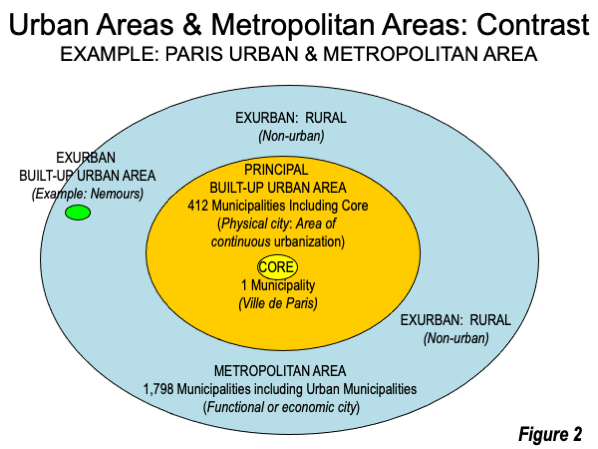
Most importantly, built-up urban areas are not metropolitan areas.
An urban area ("built-up urban area," urbanized area or urban agglomeration)2 is a continuously built-up land mass of urban development that is within a labor market (metropolitan area). An urban area contains no rural land (all land in the world is either urban or rural). However, in some nations, the term "urban area" is used for larger areas but does not denote a built-up urban area.3 This presages a major shift in world history and the history of cites.
An urban area is best thought of as the “urban footprint” — the lighted area (“city lights”) that can be observed from an airplane (or satellite) on a clear night.
Misconceptions about World Urbanization
In recent years, the world has become more than one-half urban for the first time in history (57 percent in 20224). Yet, it would be a mistake to suggest that half the world's residents live in settings similar to 5th Avenue in New York, within the fourth ring road of Beijing or in inner Paris, or for that matter in large urban areas (as much of the mainstream media too often reports).
Virtually all of the world’s large urban areas have extensive suburbs of much lower density outside the historic cores that are characterized by higher densities. Moreover, some urban areas that largely developed after post-World War II have little or no high-density urban core (See: What is a Half-Urban World) In fact, the median world urban resident5 lived in an urban area with a population of approximately 625,000. This would include for example, Springfield, MA-CT in the United States as well as Wroclaw, Poland; Geneva; Poyang, Henan in China and Jeonju, South Korea.
Notes:
- Some other urban agglomeration lists mix metropolitan areas, municipalities (parts of metropolitan areas) and urban areas (built up urban areas or agglomerations). None of these lists include urban land area data. The United Nations list is unique in providing notes that clarify the nature of its each of its listings (core cities, metropolitan areas, urban areas, and others). back to reference
- Called a "population centre" in Canada and an "urban centre" in Australia. back to reference
- For example, in China, sub-city or sub-regional districts called “shixiaqu” (市辖区) are sometimes referred to as urban areas. Shixiaqu resemble metropolitan areas, containing both urban and rural land. Districts designated as urban often have large tracts of rural land on which urban development is anticipated. back to reference
- This data is to be updated after the next release of the United Nations “World Urbanization Prospects.”back to reference
- Where one half of the world population lives in larger or smaller urban areas. back to reference
| Schedule 1 WORLD SUMMARY: BUILT-UP URBAN AREAS 500,000 & OVER: 2023 Urban Areas 500,000 & Over Population |
||||||
| GEOGRAPHY | Cases | Population | Average Density: Square Mile | Average Density: Square Kilometer | % of Urban Areas | % of Population |
| WORLD | 986 | 2,363,000,000 | 10,957 | 4,231 | 100.0% | 100.0% |
| AFRICA TOTAL | 121 | 302,149,000 | 18,106 | 6,991 | 12.3% | 12.8% |
| Angola | 4 | 13,354,000 | 23,677 | 9,142 | 0.4% | 0.6% |
| Congo (Dem. Rep)* | 12 | 26,518,000 | 36,079 | 13,930 | 1.2% | 1.1% |
| Morocco | 7 | 11,760,000 | 26,192 | 10,113 | 0.7% | 0.5% |
| Nigeria* | 24 | 54,306,000 | 13,836 | 5,342 | 2.4% | 2.3% |
| South Africa | 6 | 25,904,000 | 9,902 | 3,823 | 0.6% | 1.1% |
| Africa: Other | 68 | 170,307,000 | 20,277 | 7,829 | 6.9% | 7.2% |
| ASIA TOTAL | 524 | 1,355,009,000 | 15,938 | 6,154 | 53.1% | 57.3% |
| EAST ASIA | 251 | 614,777,000 | 12,514 | 4,832 | 25.5% | 26.0% |
| China | 213 | 472,867,000 | 12,318 | 4,756 | 21.6% | 20.0% |
| Japan | 16 | 75,976,000 | 9,978 | 3,853 | 1.6% | 3.2% |
| Korea | 10 | 35,772,000 | 19,973 | 7,712 | 1.0% | 1.5% |
| East Asia Other | 12 | 30,162,000 | 22,576 | 8,717 | 1.2% | 1.3% |
| SOUTHEAST ASIA | 55 | 188,677,000 | 17,796 | 6,871 | 5.6% | 8.0% |
| Indonesia | 23 | 76,386,000 | 23,367 | 9,022 | 2.3% | 3.2% |
| Malaysia | 5 | 14,829,000 | 9,457 | 3,651 | 0.5% | 0.6% |
| Phillipines | 9 | 31,673,000 | 29,058 | 11,219 | 0.9% | 1.3% |
| Thailand | 5 | 22,079,000 | 11,162 | 4,310 | 0.5% | 0.9% |
| Vietnam | 8 | 26,895,000 | 13,764 | 5,314 | 0.8% | 1.1% |
| Southeast Asia: Other | 5 | 16,815,000 | 22,631 | 8,738 | 0.5% | 0.7% |
| SOUTH ASIA | 130 | 375,750,000 | 30,472 | 11,765 | 13.2% | 15.9% |
| Bangladesh | 6 | 28,599,000 | 61,503 | 23,747 | 0.6% | 1.2% |
| India | 105 | 271,665,000 | 28,134 | 10,863 | 10.6% | 11.5% |
| Pakistan* | 14 | 61,241,000 | 35,751 | 13,803 | 1.4% | 2.6% |
| South Asia: Other | 5 | 14,245,000 | 28,662 | 11,066 | 0.5% | 0.6% |
| CENTRAL ASIA | 10 | 17,040,000 | 9,064 | 3,500 | 1.0% | 0.7% |
| Kazakstan | 3 | 4,867,000 | 11,345 | 4,380 | 0.3% | 0.2% |
| Uzbekistan | 5 | 9,293,000 | 7,417 | 2,864 | 0.5% | 0.4% |
| Central Asia: Other | 2 | 2,880,000 | 14,545 | 5,616 | 0.2% | 0.1% |
| WESTERN ASIA | 78 | 158,765,000 | 14,334 | 5,534 | 7.9% | 6.7% |
| Iran | 20 | 33,227,000 | 16,490 | 6,367 | 2.0% | 1.4% |
| Iraq | 10 | 15,565,000 | 27,259 | 10,525 | 1.0% | 0.7% |
| Saudi Arabia | 9 | 23,598,000 | 9,569 | 3,695 | 0.9% | 1.0% |
| Syria | 3 | 6,878,000 | 31,406 | 12,126 | 0.3% | 0.3% |
| Turkey | 15 | 34,289,000 | 18,976 | 7,327 | 1.5% | 1.5% |
| Western Asia: Other | 21 | 45,208,000 | 11,308 | 4,366 | 2.1% | 1.9% |
| EUROPE TOTAL | 138 | 220,143,000 | 7,893 | 3,048 | 14.0% | 9.3% |
| WESTERN & CENTRAL EUROPE | 92 | 153,616,000 | 8,609 | 3,324 | 9.3% | 6.5% |
| EUROPEAN UNION | 70 | 122,775,000 | 8,066 | 3,114 | 7.1% | 5.2% |
| France | 8 | 18,475,000 | 7,696 | 2,972 | 0.8% | 0.8% |
| Germany | 14 | 25,650,000 | 7,322 | 2,827 | 1.4% | 1.1% |
| Italy | 9 | 17,259,000 | 7,630 | 2,946 | 0.9% | 0.7% |
| Spain | 10 | 18,632,000 | 12,028 | 4,644 | 1.0% | 0.8% |
| Poland | 7 | 7,662,000 | 7,468 | 2,883 | 0.7% | 0.3% |
| EU-Other | 22 | 35,097,000 | 7,834 | 3,025 | 2.2% | 1.5% |
| OUTSIDE EUROPEAN UNION | 22 | 30,841,000 | 11,756 | 4,539 | 2.2% | 1.3% |
| United Kingdom | 16 | 25,570,000 | 12,065 | 4,658 | 1.6% | 1.1% |
| Western & Central Europe: Other | 6 | 5,271,000 | 10,458 | 4,038 | 0.6% | 0.2% |
| EASTERN EUROPE | 46 | 66,527,000 | 6,622 | 2,557 | 4.7% | 2.8% |
| Ukraine | 7 | 9,745,000 | 7,213 | 2,785 | 0.7% | 0.4% |
| Russia (Including Asia) | 36 | 53,465,000 | 6,384 | 2,465 | 3.7% | 2.3% |
| Eastern Europe: Other | 3 | 3,317,000 | 10,366 | 4,002 | 0.3% | 0.1% |
| NORTH AMERICA: TOTAL | 125 | 288,922,000 | 4,183 | 1,615 | 12.7% | 12.2% |
| Canada | 9 | 18,757,000 | 6,450 | 2,490 | 0.9% | 0.8% |
| Mexico | 32 | 57,665,000 | 12,973 | 5,009 | 3.2% | 2.4% |
| United States | 70 | 187,824,000 | 3,160 | 1,220 | 7.1% | 7.9% |
| North America Other | 14 | 24,676,000 | 10,837 | 4,184 | 1.4% | 1.0% |
| OCEANIA: TOTAL | 6 | 17,493,000 | 4,181 | 1,614 | 0.6% | 0.7% |
| Australia | 5 | 15,956,000 | 4,014 | 1,550 | 0.5% | 0.7% |
| Oceania Other (Only New Zealand) | 1 | 1,537,000 | 7,354 | 2,839 | 0.1% | 0.1% |
| SOUTH AMERICA: TOTAL | 72 | 179,284,000 | 14,004 | 5,407 | 7.3% | 7.6% |
| Argentina | 9 | 23,313,000 | 11,149 | 4,305 | 0.9% | 1.0% |
| Brazil | 33 | 87,597,000 | 12,484 | 4,820 | 3.3% | 3.7% |
| Colombia | 9 | 22,149,000 | 37,351 | 14,421 | 0.9% | 0.9% |
| Venezuela | 7 | 9,704,000 | 13,478 | 5,204 | 0.7% | 0.4% |
| South America Other | 14 | 36,521,000 | 15,339 | 5,922 | 1.4% | 1.5% |
| * Estimates in these geographies may be unreliable due to long census interval or census result disputes. See the Introduction |
||||||
Wendell Cox is principal of Demographia, an international public policy firm located in the St. Louis metropolitan area. He is a founding senior fellow at the Urban Reform Institute, Houston, a Senior Fellow with the Frontier Centre for Public Policy in Winnipeg and a member of the Advisory Board of the Center for Demographics and Policy at Chapman University in Orange, California. He has served as a visiting professor at the Conservatoire National des Arts et Metiers in Paris. His principal interests are economics, poverty alleviation, demographics, urban policy and transport. He is co-author of the annual Demographia International Housing Affordability Survey and author of Demographia World Urban Areas.
Mayor Tom Bradley appointed him to three terms on the Los Angeles County Transportation Commission (1977-1985) and Speaker of the House Newt Gingrich appointed him to the Amtrak Reform Council, to complete the unexpired term of New Jersey Governor Christine Todd Whitman (1999-2002). He is author of War on the Dream: How Anti-Sprawl Policy Threatens the Quality of Life and Toward More Prosperous Cities: A Framing Essay on Urban Areas, Transport, Planning and the Dimensions of Sustainability.
Photo: Barcelona (by author): This year’s cover photograph (above) features the Barcelona urban area, half of which is south of the Serra de Collserola, which separates the core city and coastal suburbs from the more distant but continuous suburbs in the Valles Occidental, such as Sabadel and Terrassa, and the Valles Orientale. About one-half of the population is south of the mountains, including Barcelona and the other half is north of the mountains.


