The Census Bureau has just published its 2020 state population estimates, which indicate that the state that has led growth in the United States for the last 170 years lost 70,000 residents last year. For the first five years of the decade, California had gained 300,000 residents, with a total gain over the period of 1.6 million. Since 2015, California’s population gain plummeted, reaching virtually zero in 2019 and the loss in 2020 (Figure 1). At the same time, the Census Bureau restated California’s 2018 to 2019 population change, which had been shown as a gain of 51,000 last year to a gain of only 147.
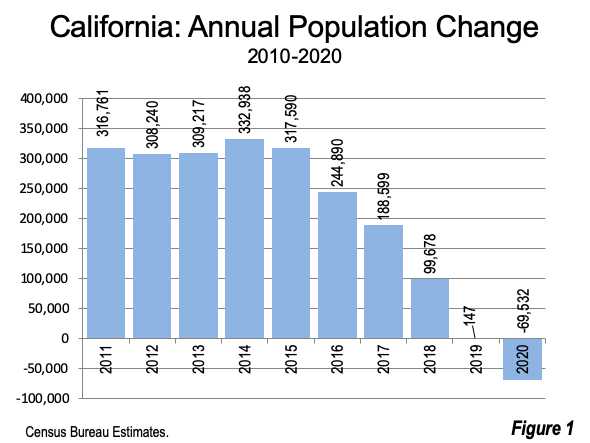
This may be California’s first annual population loss since statehood (1850). According to Census Bureau data reported by macrotrends.net, California had gained population in every year since 1900. Earlier annual data was not found.
National Trends
Overall, the national population growth rate has been falling throughout the decade. In 2011, the nation added 0.73% to its population, and fell to 0.35% in 2020. In 2019, the gain was 0.46%. The smaller gain in 2020 is likely attributable to the generally downward trend and smaller international migration flows in the COVID environment.
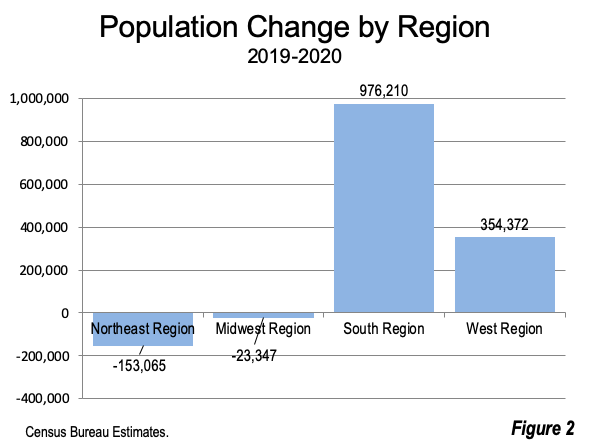
Over the past year, the South has accounted for 85% of the nation’s growth, adding nearly 1,000,000 residents. The West had 30% of the growth (350,000). The Midwest experienced a modest loss (20,000), while the Northeast lost more than 150,000 residents (Figure 2).
Fastest Gainers
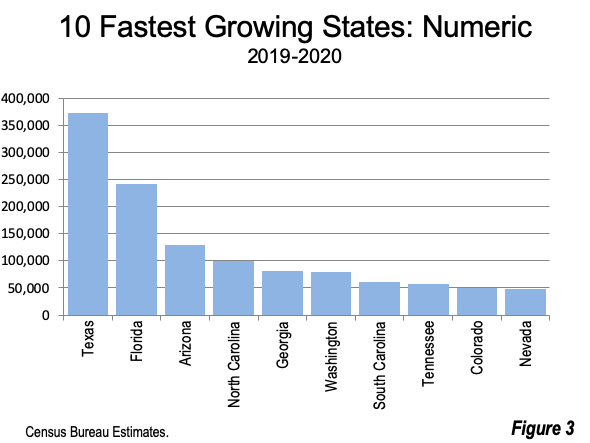
Texas added the largest number of residents in the last year, at 374,000. Florida was second, at 241,000 and Arizona was third at 130,000 (Figure 3). Among the top ten states, six were from the South and the other four from the Intermountain West. The five Pacific Coast states added about 25,000 residents, with an 80,000 gain in Washington and 25,000 in Oregon, which was nearly offset by losses in California, Hawaii and Alaska.
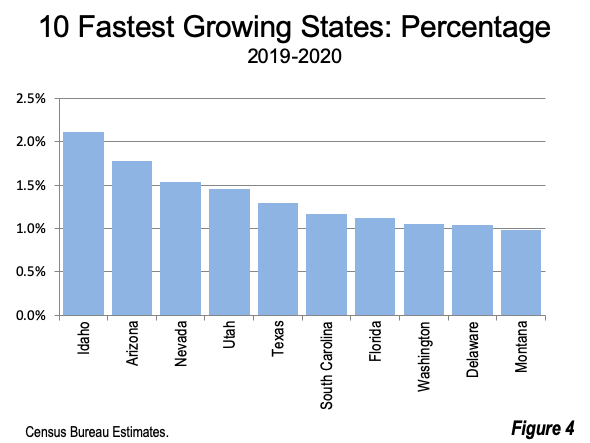
The largest percentage gain was in Idaho, which added 2.11% between 2019 and 2020. Arizona, Nevada and Utah all gained more than 1.40%. Texas ranked 5th, while Florida placed 7th (Figure 4).
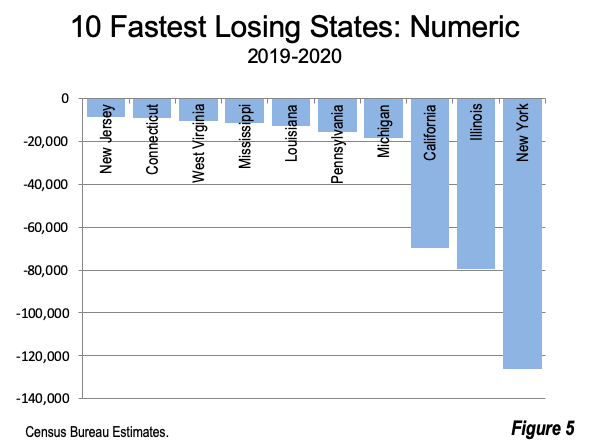
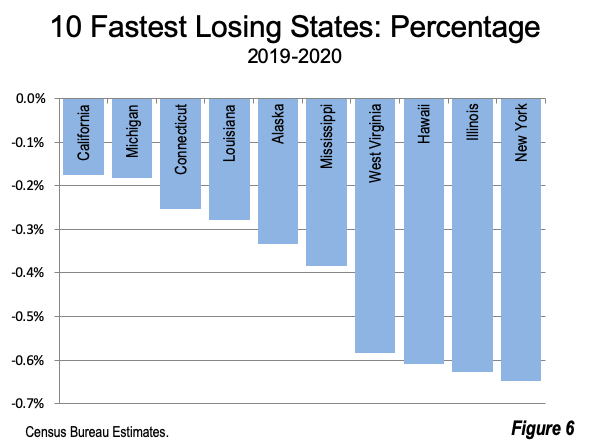
Fastest Losers
By far the largest losses were in New York (minus 126,000), Illinois (minus 79,000) and California (minus 70,000). Sixteen states had population losses (Figure 5). New York had the largest percentage loss from 2019 to 2020, at 0.65%. The largest percentage losses were in Illinois, Hawaii and West Virginia, all had losses exceeding 0.55%. California had the 10th largest percentage loss, at 0.18% (Figure 6).
As was the case in 2010, this year’s estimates did not include migration data, unlike the earlier years in the decade.
The 2020 estimates will be superseded by the 2020 Census counts, which will be released in the near future.
The table below shows the 2010 Census as well as the 2019 and 2020 population estimates.
Wendell Cox is principal of Demographia, an international public policy firm located in the St. Louis metropolitan area. He is a founding senior fellow at the Urban Reform Institute, Houston and a member of the Advisory Board of the Center for Demographics and Policy at Chapman University in Orange, California. He has served as a visiting professor at the Conservatoire National des Arts et Metiers in Paris. His principal interests are economics, poverty alleviation, demographics, urban policy and transport. He is co-author of the annual Demographia International Housing Affordability Survey and author of Demographia World Urban Areas.
Mayor Tom Bradley appointed him to three terms on the Los Angeles County Transportation Commission (1977-1985) and Speaker of the House Newt Gingrich appointed him to the Amtrak Reform Council, to complete the unexpired term of New Jersey Governor Christine Todd Whitman (1999-2002). He is author of War on the Dream: How Anti-Sprawl Policy Threatens the Quality of Life and Toward More Prosperous Cities: A Framing Essay on Urban Areas, Transport, Planning and the Dimensions of Sustainability.
Photograph: Great Seal of the State of California via Wikimedia.
2020 Population Estimates
| 2010 Census | 2019 Estimate | 2020 Estimate | 2019-20 # | 2019-20 % | |
| United States | 309,327,143 | 328,329,953 | 329,484,123 | 1,154,170 | 0.35% |
| Alabama | 4,785,514 | 4,907,965 | 4,921,532 | 13,567 | 0.28% |
| Alaska | 713,982 | 733,603 | 731,158 | (2,445) | -0.33% |
| Arizona | 6,407,342 | 7,291,843 | 7,421,401 | 129,558 | 1.78% |
| Arkansas | 2,921,998 | 3,020,985 | 3,030,522 | 9,537 | 0.32% |
| California | 37,319,550 | 39,437,610 | 39,368,078 | (69,532) | -0.18% |
| Colorado | 5,047,539 | 5,758,486 | 5,807,719 | 49,233 | 0.85% |
| Connecticut | 3,579,173 | 3,566,022 | 3,557,006 | (9,016) | -0.25% |
| Delaware | 899,647 | 976,668 | 986,809 | 10,141 | 1.04% |
| District of Columbia | 605,282 | 708,253 | 712,816 | 4,563 | 0.64% |
| Florida | 18,846,143 | 21,492,056 | 21,733,312 | 241,256 | 1.12% |
| Georgia | 9,712,209 | 10,628,020 | 10,710,017 | 81,997 | 0.77% |
| Hawaii | 1,364,004 | 1,415,615 | 1,407,006 | (8,609) | -0.61% |
| Idaho | 1,570,819 | 1,789,060 | 1,826,913 | 37,853 | 2.12% |
| Illinois | 12,840,545 | 12,667,017 | 12,587,530 | (79,487) | -0.63% |
| Indiana | 6,490,555 | 6,731,010 | 6,754,953 | 23,943 | 0.36% |
| Iowa | 3,050,819 | 3,159,596 | 3,163,561 | 3,965 | 0.13% |
| Kansas | 2,858,266 | 2,912,635 | 2,913,805 | 1,170 | 0.04% |
| Kentucky | 4,348,464 | 4,472,345 | 4,477,251 | 4,906 | 0.11% |
| Louisiana | 4,544,635 | 4,658,285 | 4,645,318 | (12,967) | -0.28% |
| Maine | 1,327,651 | 1,345,770 | 1,350,141 | 4,371 | 0.32% |
| Maryland | 5,788,784 | 6,054,954 | 6,055,802 | 848 | 0.01% |
| Massachusetts | 6,566,440 | 6,894,883 | 6,893,574 | (1,309) | -0.02% |
| Michigan | 9,877,597 | 9,984,795 | 9,966,555 | (18,240) | -0.18% |
| Minnesota | 5,310,934 | 5,640,053 | 5,657,342 | 17,289 | 0.31% |
| Mississippi | 2,970,615 | 2,978,227 | 2,966,786 | (11,441) | -0.38% |
| Missouri | 5,996,089 | 6,140,475 | 6,151,548 | 11,073 | 0.18% |
| Montana | 990,730 | 1,070,123 | 1,080,577 | 10,454 | 0.98% |
| Nebraska | 1,829,591 | 1,932,571 | 1,937,552 | 4,981 | 0.26% |
| Nevada | 2,702,483 | 3,090,771 | 3,138,259 | 47,488 | 1.54% |
| New Hampshire | 1,316,807 | 1,360,783 | 1,366,275 | 5,492 | 0.40% |
| New Jersey | 8,799,451 | 8,891,258 | 8,882,371 | (8,887) | -0.10% |
| New Mexico | 2,064,614 | 2,099,634 | 2,106,319 | 6,685 | 0.32% |
| New York | 19,399,956 | 19,463,131 | 19,336,776 | (126,355) | -0.65% |
| North Carolina | 9,574,586 | 10,501,384 | 10,600,823 | 99,439 | 0.95% |
| North Dakota | 674,752 | 763,724 | 765,309 | 1,585 | 0.21% |
| Ohio | 11,539,449 | 11,696,507 | 11,693,217 | (3,290) | -0.03% |
| Oklahoma | 3,760,014 | 3,960,676 | 3,980,783 | 20,107 | 0.51% |
| Oregon | 3,837,614 | 4,216,116 | 4,241,507 | 25,391 | 0.60% |
| Pennsylvania | 12,711,406 | 12,798,883 | 12,783,254 | (15,629) | -0.12% |
| Rhode Island | 1,053,994 | 1,058,158 | 1,057,125 | (1,033) | -0.10% |
| South Carolina | 4,635,846 | 5,157,702 | 5,218,040 | 60,338 | 1.17% |
| South Dakota | 816,193 | 887,127 | 892,717 | 5,590 | 0.63% |
| Tennessee | 6,355,518 | 6,830,325 | 6,886,834 | 56,509 | 0.83% |
| Texas | 25,241,897 | 28,986,794 | 29,360,759 | 373,965 | 1.29% |
| Utah | 2,775,413 | 3,203,383 | 3,249,879 | 46,496 | 1.45% |
| Vermont | 625,886 | 624,046 | 623,347 | (699) | -0.11% |
| Virginia | 8,024,004 | 8,556,642 | 8,590,563 | 33,921 | 0.40% |
| Washington | 6,743,009 | 7,614,024 | 7,693,612 | 79,588 | 1.05% |
| West Virginia | 1,854,265 | 1,795,263 | 1,784,787 | (10,476) | -0.58% |
| Wisconsin | 5,690,538 | 5,824,581 | 5,832,655 | 8,074 | 0.14% |
| Wyoming | 564,531 | 580,116 | 582,328 | 2,212 | 0.38% |
| Source: US Census Bureau | |||||


