
As the San Francisco Bay Area (combined statistical area, or CSA, as defined by the Office of Management and Budget) has sprawled into the San Joaquin Valley, all population growth has been in the three Valley metros for two years (Map above). This article describes population trends over the last 10 years in the CSA, which includes the six tidewater (adjacent to the ocean or the Bay) metropolitan areas, traditionally thought of as the Bay Area, including core San Francisco and San Jose as well as Santa Rosa, Napa, Vallejo and Santa Cruz. The CSA also includes San Joaquin (Central) Valley metros of Stockton, Modesto, and Merced, added to the area within the last decade or so in response to the large number of additional commuters from these areas.
Yet in each of the last two years (2019 and 2020), the United States Census Bureau’s population estimates program has shown population losses in the six tidewater metropolitan areas in the Bay Area CSA (the San Francisco, Napa, Santa Cruz, Santa Rosa, and Vallejo metros). Overall, population losses became so substantial here, that the entire CSA posted losses in 2019 and 2020. Remarkably this has happened even as the Silicon Valley, principally located in the core San Jose and San Francisco metros, experienced enormous economic booms.
Population and Population Growth
Population growth and domestic migration is described for the nine metropolitan areas that make up the San Francisco Bay CSA.
The San Francisco Metropolitan Area
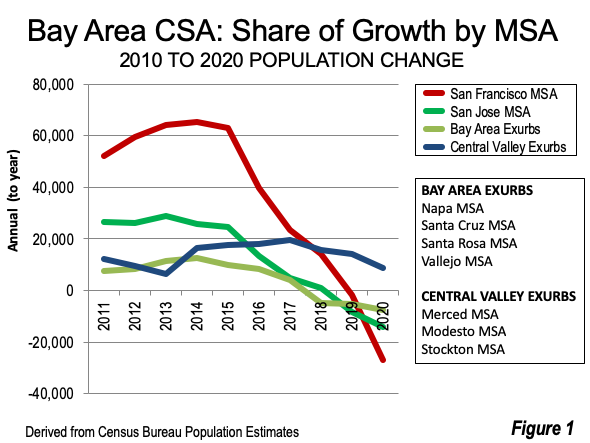
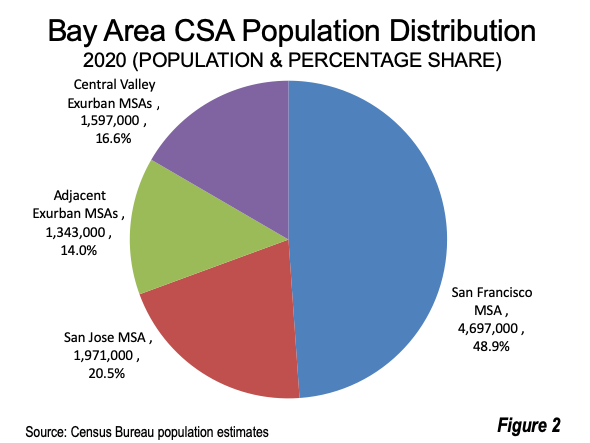
The San Francisco metropolitan area is extensive, stretching from downtown San Franciso nearly 60 miles to northern Marin County, a similar to distance to eastern Alameda and Contra Costa counties to more than 30 miles to southern San Mateo County, which is the northern border of the San Jose metro. The San Francisco metro comprises nearly 50% of the Bay Area population (Figure 1). In the first year of the decade (2011), the metropolitan area gained slightly more than its population share, at 53% (Figure 2). By 2020, however, the San Francisco metro was losing population by 2020, that percentage had slipped to 49%.
The decline in the city of San Francisco growth rate has been substantial. In the first half of the decade, the city gained 58,000 residents, at a 1.4% annual rate. Between 2015 and 2020, the city population expanded by only 3,000 new residents, for a negligible annual rate of 0.007%. First half growth in the decade was 18 times that of the second half. The city accounted for 7.2% of the CSA growth from 2010 to 2015, dropping to 0.4% between 2015 and 2020.
Within metro San Francisco, Alameda and Contra Costa have added the most population since 2010, but their growth plummeted in the second half of the decade. Alameda and Contra Costa added 28,000 each in the final five years, compared to 121,000 and 72,000 respectively from 2010-2015.
The other two counties in the San Francisco metropolitan area lost population in the last five years. San Mateo County, the northern extension of Silicon Valley, gained 46,000 in the first five years, and lost 7,000 in the last five.
Marin County gained 8,000 in the earlier half of the decade, but fell to minus 4,000 in the second half.
The San Jose Metropolitan Area
Santa Clara County, which includes San Jose, gained the most between 2010 and 2015, gaining some 130,000 residents but lost 9,000 from 2015-2020. Exurban San Benito County, also in the San Jose metropolitan area gained 3,000 in the first five years, and doubled its gain to 6,000 in the last five years.
Exurban Tidewater Metropolitan Areas
Three of the four exurban tidewater counties (which are also metro areas) — like San Francisco and San Jose, burdened with especially high housing prices and congestion — lost population in the second half of the decade. Santa Cruz (metro), Napa (metro) and Sonoma (Santa Rosa metro) all posted gains in the first half of the decade but losses in the second. Further out Solano County (Vallejo metro), part of which is in the Sacramento (Central) Valley, had a second half gain of 14,000, down from 19,000 in the first half of the decade. Solano’s decade gain in the second half of the decade was more than four times that of San Francisco, which has nearly double the population.
Exurban San Joaquin Valley Metropolitan Areas
Nearly two-thirds of the Bay Area growth in 2020 was not in the tidewater metros in the three recently added San Joaquin Valley metros which extend up to roughly 150 miles away from downtown San Francisco. These had been added to the CSA in the last decade or so, as increased commuting occurred between from these metros to the tidewater metros, likely because of less unaffordable housing.
The bulk of the population growth has moved to the periphery, no doubt troubling to the Bay Area’s density-obsessed planners. The San Joaquin (Central) Valley metropolitan areas accounted for 65% of the growth in the San Francisco Bay Area CSA over the last five years of the decade, up from 11% in the first half. The increase in growth, rising from 62,000 to 76,000, was the flip side of the implosion of growth in the tidewater metros.
San Joaquin County (Stockton metro) improved its growth from 34,000 in 2010-5 to 46,000 in 2015-2020, about 15 times that of larger San Francisco County. Stanislaus County (Modesto metro) gained 18,000 in the first half of the decade, then dropped to 17,000 in the second half. Merced County had a strong increase from 9,000 to 13,000. Merced County (Merced metro) is the southernmost extent of the San Francisco Bay CSA in the San Joaquin Valley, borders Fresno County, and is 150 miles away. The city of Fresno is near the mid-point (186 miles of the 405 miles, or 45% of the way) between the downtowns of San Francisco and Los Angeles.
Net Domestic Migration
Shifting losses in net domestic migration drove the declines in the tidewater metropolitan areas (Figure 3). Overall, the Bay Area CSA lost 223,000 net domestic migrants, with a minus 293,000 in the 10 county tidewater metro areas. The three San Joaquin Valley metros gained 20,000 met domestic migrants.
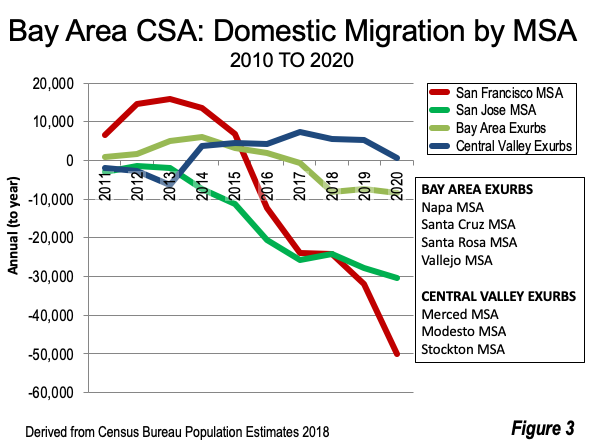
Again, the last half of the decade exhibited larger net domestic migration in the tidewater metros. San Francisco gained 58,000 from 2010-2015, but lost 142,000 from 2015-2020. San Francisco started with the largest net domestic migration gains in 2010 and continued to lead through 2015. By 2018, San Francisco was losing the most net domestic migrants and continued with the CSA’s largest losses through 2020.
The San Jose metro has consistently lost net domestic migrants, but in increasing numbers, from under 3,000 annually in the first three years of the decade to 30,000 in 2020. The first five year loss was 25,000, but expanded to a 128,000 loss in the last five years.
The exurban metros gained 17,000 net domestic migrants from 2010 to 2015, and lost 23,000 in the last five years.
The San Joaquin Valley metros lost 3,000 net domestic migrants in the first five years, and added 23,000 from 2015 to 2020.
A Big Reversal
The downward trend in metropolitan area growth and net domestic migration has been substantial — even in the global center of the burgeoning tech sector. If this were a mainstream media article on Japan or China, the term “demographic implosion” would likely have been used for the San Francisco and San Jose metros, including the Silicon Valley. Most likely, with the Bay Area’s high cost of living and severely unaffordable housing, the implosion might well continue in the next decade as well.
Wendell Cox is principal of Demographia, an international public policy firm located in the St. Louis metropolitan area. He is a founding senior fellow at the Urban Reform Institute, Houston, a Senior Fellow with the Frontier Centre for Public Policy in Winnipeg and a member of the Advisory Board of the Center for Demographics and Policy at Chapman University in Orange, California. He has served as a visiting professor at the Conservatoire National des Arts et Metiers in Paris. His principal interests are economics, poverty alleviation, demographics, urban policy and transport. He is co-author of the annual Demographia International Housing Affordability Survey and author of Demographia World Urban Areas.
Mayor Tom Bradley appointed him to three terms on the Los Angeles County Transportation Commission (1977-1985) and Speaker of the House Newt Gingrich appointed him to the Amtrak Reform Council, to complete the unexpired term of New Jersey Governor Christine Todd Whitman (1999-2002). He is author of War on the Dream: How Anti-Sprawl Policy Threatens the Quality of Life and Toward More Prosperous Cities: A Framing Essay on Urban Areas, Transport, Planning and the Dimensions of Sustainability.
Top illustration: Screen shot of the San Francisco Bay Area combined statistical area (officially the San Jose-San Francisco combined statistical area). From: Census.gov.


Are there parallels?
Other cases of CSAs showing population loss amid a period of economic growth?