
Late in the last decade, domestic migrants began moving to smaller metropolitan areas and micropolitan areas (CBSA’s) as domestic migration to the larger metropolitan areas fell. The trend was covered in “Domestic Migration to Dispersion Accelerates (Even Before Covid).” The trend has continued, especially in the year ended July 1, 2021, according to Census Bureau estimates.
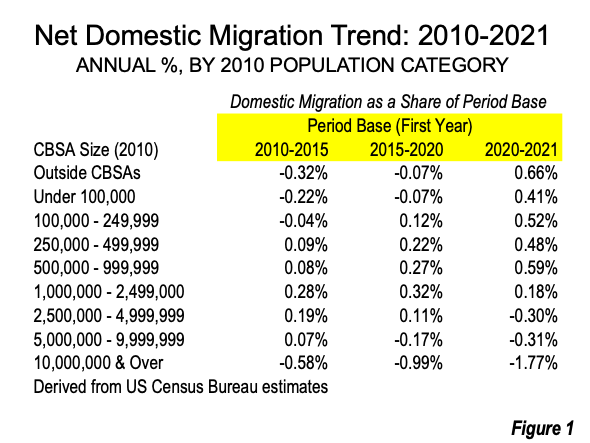
This is indicated in Figure 1, which shows annual net domestic migration percentage by size of Core Based Statistical Areas (metropolitan areas and micropolitan areas) as well as to areas outside CBSAs (Note 1) for three periods, 2010-2015, 2015-2020 and 2020-2021. In each of the largest CBSA population categories (1,000,000 and over), the smallest net domestic migration occurred in 2020-2021, with only the 1,000,000 to 2,499,999 category gaining. The largest net domestic migration figures were achieved in 2020-2021 for the smaller population categories. At the same time, areas outside the CBSAs (which are not to be confused with rural areas, see Note 2), had the largest 2020-2021 percentage gain.
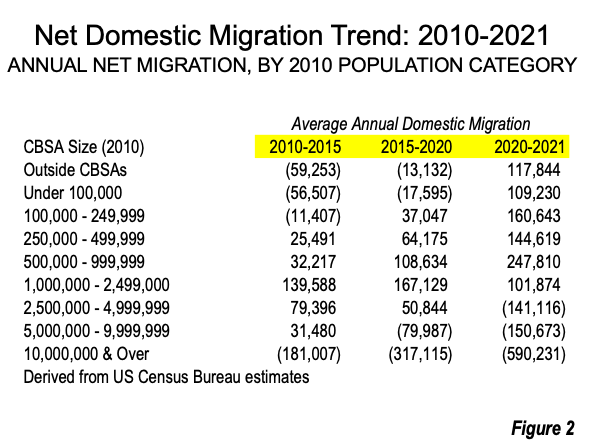
The population change data for all of the population categories is illustrated in Figure 2.
Domestic Migration by CBSA Population
The largest metropolitan areas — the two megacities, with more than 10 million residents in 2010, were already losing hundreds of thousands of net domestic migrants in 2010-2015, and more than trebled their losses by 2020-2021. New York lost 385,000, while Los Angeles lost 205,000.
The second largest metropolitan population category (5,000,000 to 9,999,999 in 2010) had a modest annual gain in 2010-2015, but by 2021 lost 151,000. However, this category included the metropolitan area with the second largest net domestic migrant gain, Dallas-Fort Worth, which added 54,000 net domestic migrants. Atlanta gained 25,000 and Houston 24,000. Chicago lost 109,000, while Washington (DC-VA-MD-WV) sustained a 67,000 loss, as did Miami (minus 55,000).
The third largest metropolitan population category (2,500,000 to 4,999,999 in 2010) had annual gains in both of the previous periods, but lost 141,000 in 2020-2021.The strongest gain in this category was in Tampa-St. Petersburg, at 42,000, followed by Riverside-San Bernardino, at 35,000. In the last year Riverside-San Bernardino passed San Francisco in population to become California’s second largest metropolitan area. The largest net domestic migration losses were in San Francisco, at minus 129,000, Boston, at minus 48,000 and Seattle, at minus 31,000. Seattle is a genuine surprise, since it had been a national domestic migration leader in most recent years.
The metropolitan areas with from 1,000,000 to 2,499,999 population in 2010 had annual net domestic migration gains in all three periods. The largest 2020-2021 gains were in Austin, at 40,000 and San Antonio, at 26,000, their urban cores being only 80 miles apart. Jacksonville gained 25,000, Charlotte 24,000 and Raleigh 22,000. The largest loss was in San Jose, at minus 61,000.
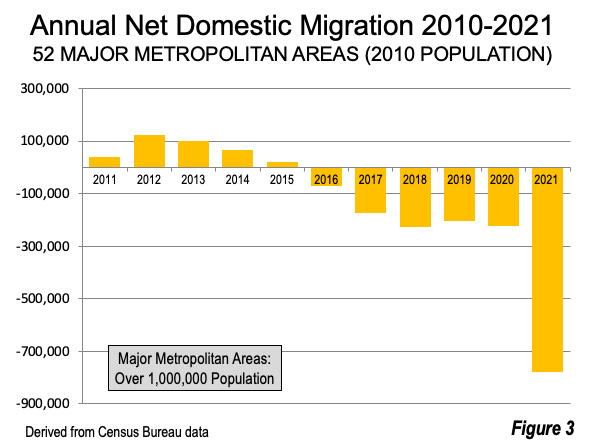
The downward trend in net domestic migration to the major metropolitan areas (the four largest categories — over 1,000,000 in 2010) has been pronounced (Figure 3).
The largest overall net domestic migration gain was in the metropolitan areas with from 500,000 to 999,999 population in 2010, at 248,000. This was nearly eight times the average from 2010 to 2015. The largest gainers were Sarasota, FL, at 29,000, Cape Coral, FL, at 26,000, Lakeland, FL, at 25,000 and Boise, ID, at 24,000. The largest loss in the category was in Honolulu, at minus 17,000.
The 250,000 to 499,999 2010 population category added net domestic migrants in 2021 at nearly six times the rate of 2010-2015. The largest gainers were Myrtle Beach, SC-NC, at 22,000 and Port St. Lucie, FL, at 16,000. The largest losses were in Salinas, CA and Santa Maria (Santa Barbara), CA at between 3,000 and 4,000.
The 100,000 to 249,999 2010 population category lost an average of 11,000 net domestic migrants, and increased to 161,000 in 2020-2021. The leaders in this category were Punta Gorda, FL and St. George, UT, at 9,000. Even with this gain, a number of CBSAs sustained losses, and the largest in this category was in Lake Charles, LA, at 12,000.
Among the CBSA’s with under 100,000 population in 2010, there was a loss of 57,000 net domestic migrants in 2010-2015, which became a 109,000 gain by 2020-2021. The Villages, FL had the largest gain, at 7,000, while Williston, ND had the largest loss, at minus 3,000.
Outside the CBSA’s there was a average loss of 59,000 in 2010-2015, which was transformed into a gain of 118,000 in 2020-2021. Their 0.66% net gain was the largest of any population category in 2020-2021. This gain was a surprise, since areas outside the CBSAs (which are not to be confused with rural areas, see Note 2), have had gained only once in the past 11 years, and even then in a much smaller amount (7,000).
Domestic Migration Percentage Leaders
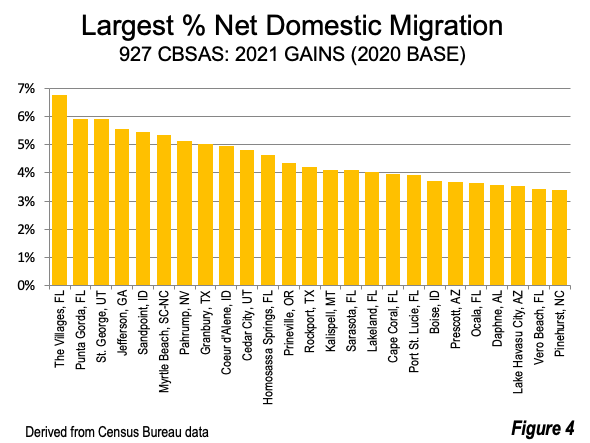
The 25 CBSAs out of the total of 927 that had the highest percentage of net domestic migration in 2021 relative to their 2020 population are shown in Figure 4. The highest was The Villages, FL, with other Florida CBSAs Punta Gorda (2nd ranked), Homosassa Springs, Sarasota, Lakeland, Cape Coral, Port St Lucie, Ocala, Vero Beach and Sebring in the top 25. Each of these metros are senior citizen oriented, as well as being within hybrid or remote physical commuting distance of major job centers, such as Tampa-St. Petersburg, Miami, Orlando and Jacksonville. St. George, UT ranks third, and is both a senior magnet and also a remote/hybrid commute from metro Las Vegas. Cedar City, UT is a somewhat longer remote commute to Las Vegas. Other exurban CBSAs are also on the list, such as Jefferson, GA (near Atlanta), Coeur d’Alene and Sandpoint, ID (near Spokane), Granbury, TX (near Dallas-Fort Worth) and Pahrump, NV (near Las Vegas). Boise, ID is attracting large numbers of domestic migrants as it becomes a growing urban center in its own right.
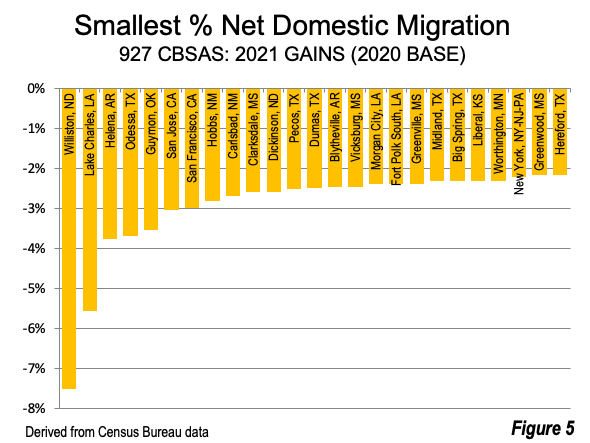
The largest percentage losses were in energy producing Williston, ND and Lake Charles, LA. Three major metropolitan areas were among the 25 with the largest percentage loss, San Jose, San Francisco and New York (Figure 5).
Even Half a Blip Would be Substantial
It is, of course, possible that the 2021 is a blip in net domestic migration that will not be soon replicated. But critically these patterns were in place before the pandemic. And it is not clear that Covid has finished its work, with new pandemic “waves,” and even a “sixth wave” in neighboring Canada. A return to the “new normal” may not be as near as was thought. Even if in future years domestic migration should fall to only one-half its recent acceleration, it would still be substantial and mark a critical transformation of the country’s demography.
Note 1: Metropolitan and micropolitan area criteria are organized around “urban areas.” The two classifications differ in the population of the core urban area. Those with urban areas of 50,000 or more residents are metropolitan areas, while those with from 10,000 to 49,999 residents are micropolitan areas.
Note 2: Areas outside CBSA’s are not rural, they are simply not in metropolitan or micropolitan areas. As the Office of Management and Budget put it in the 2020 metropolitan area criteria, “The CBSA classification is not an urban-rural classification; Metropolitan and Micropolitan Statistical Areas and many counties outside CBSAs contain both urban and rural populations.” Indeed, in 2010, only 16 counties of the more than 3,100 in the United States did not have rural territory. This excludes cities that are county equivalents in Virginia, in which cities cannot be in counties.
Wendell Cox is principal of Demographia, an international public policy firm located in the St. Louis metropolitan area. He is a founding senior fellow at the Urban Reform Institute, Houston, a Senior Fellow with the Frontier Centre for Public Policy in Winnipeg and a member of the Advisory Board of the Center for Demographics and Policy at Chapman University in Orange, California. He has served as a visiting professor at the Conservatoire National des Arts et Metiers in Paris. His principal interests are economics, poverty alleviation, demographics, urban policy and transport. He is co-author of the annual Demographia International Housing Affordability Survey and author of Demographia World Urban Areas.
Mayor Tom Bradley appointed him to three terms on the Los Angeles County Transportation Commission (1977-1985) and Speaker of the House Newt Gingrich appointed him to the Amtrak Reform Council, to complete the unexpired term of New Jersey Governor Christine Todd Whitman (1999-2002). He is author of War on the Dream: How Anti-Sprawl Policy Threatens the Quality of Life and Toward More Prosperous Cities: A Framing Essay on Urban Areas, Transport, Planning and the Dimensions of Sustainability.
Photo: Riverside-San Bernardino: Now California’s second largest metropolitan, having displaced San Francisco, via Wikmedia.


