
Between 2021 and 2022, the populations of California, Illinois, and New York all declined by more than 100,000 people, according to estimates released a few weeks ago by the Census Bureau. Louisiana, Oregon, Pennsylvania, and West Virginia all lost more than 10,000 residents, while 11 other states also declined in population.
Red, orange, and yellow states lost population, while green states gained. No state lost between 50,000 and 99,999, so there is no color for that group. Click image below for a larger view — opens in new tab or window.
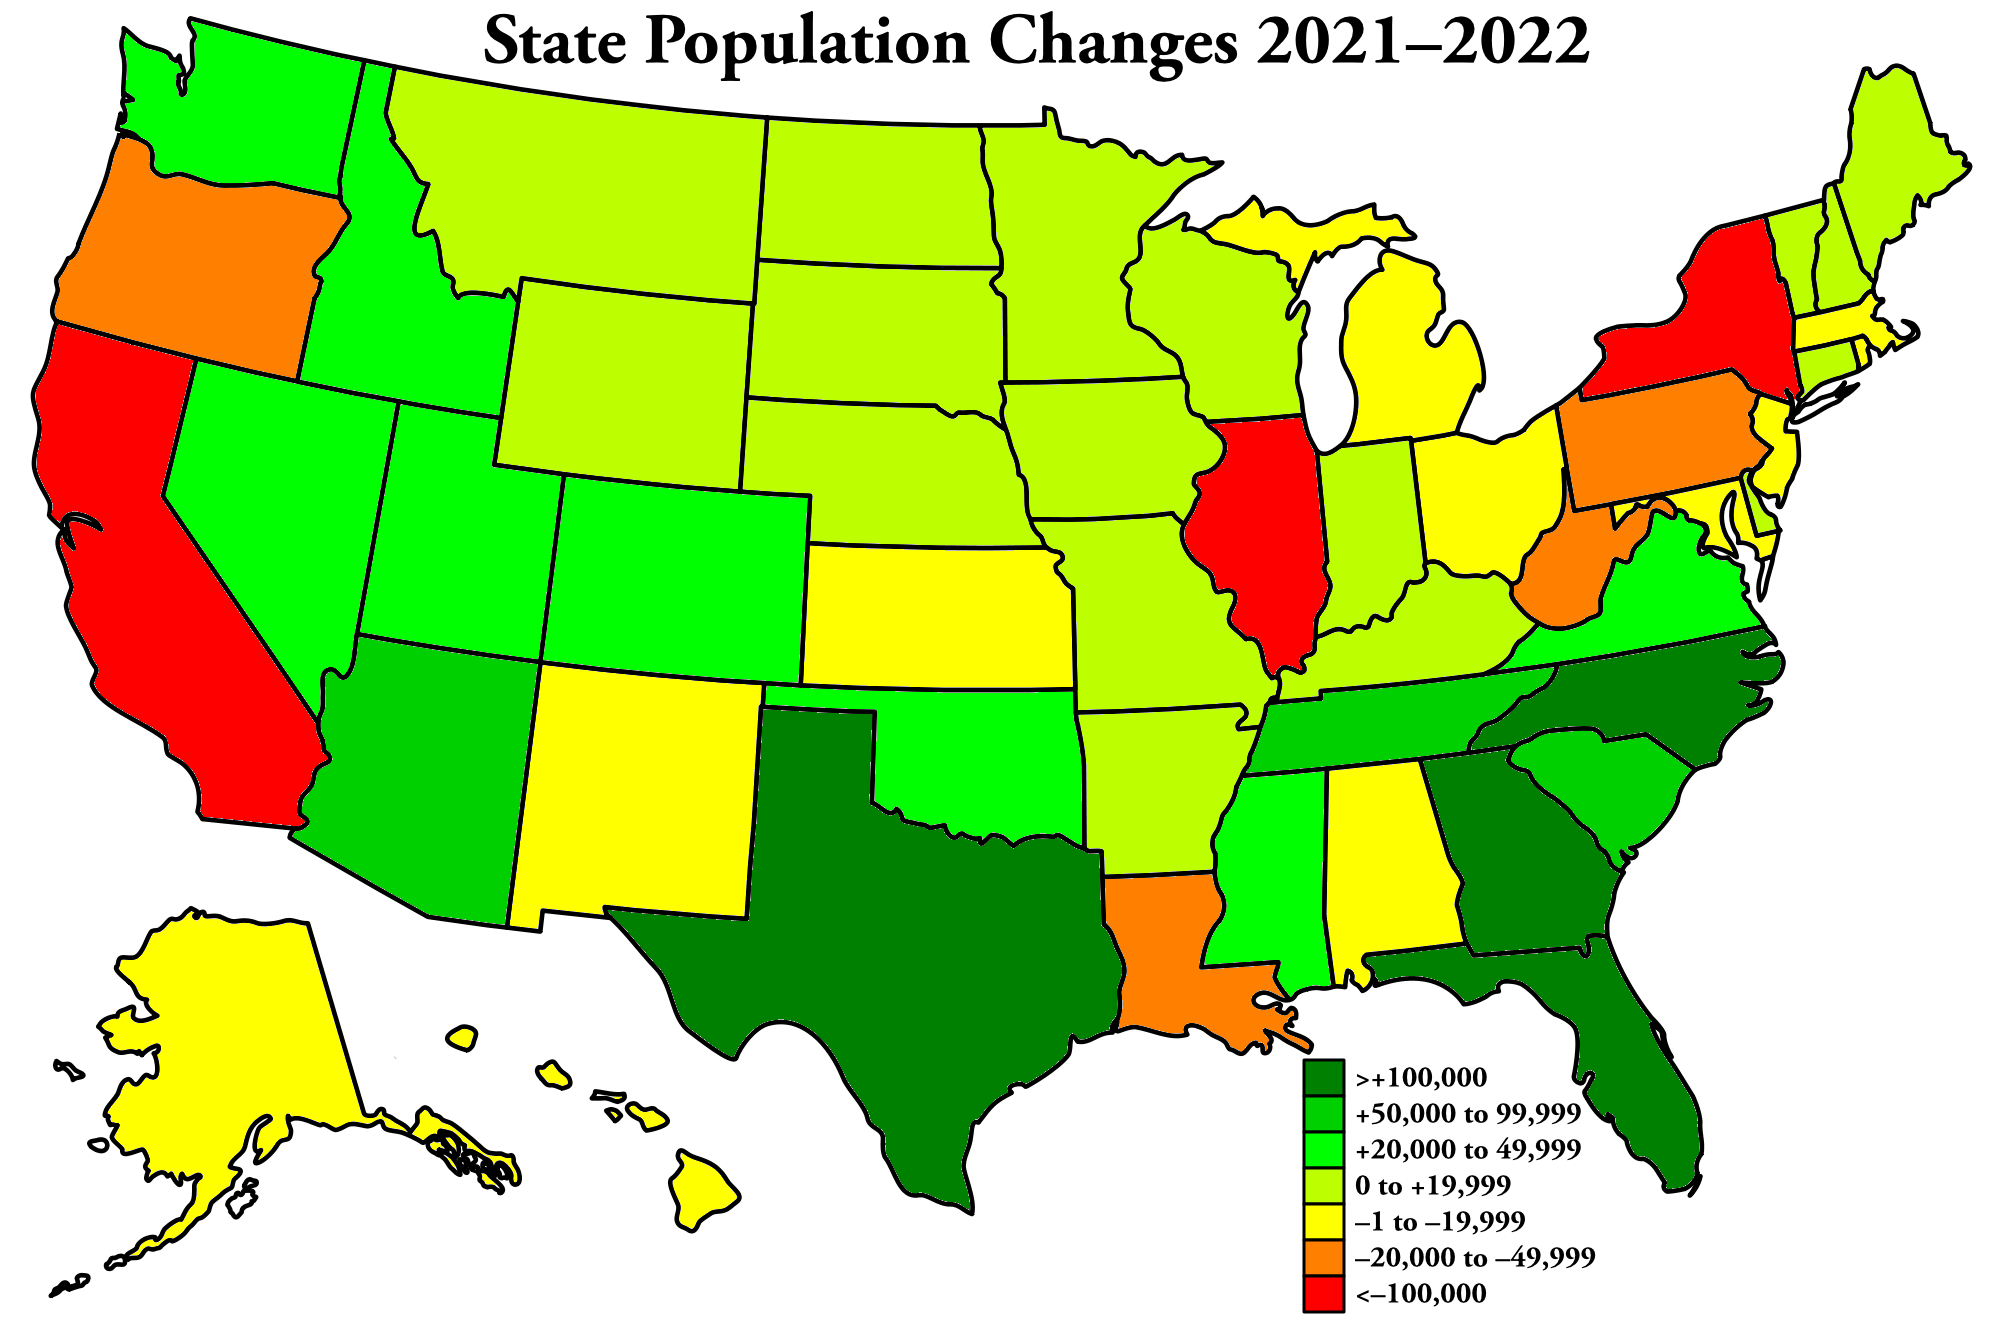
The nation as a whole grew by 1.26 million, but clearly that gain was not evenly distributed. Instead, Texas grew by 470,000 residents, Florida by 416,000, North Carolina by 133,000, Georgia by 125,000, Arizona by 94,000, South Carolina by 89,000, and Tennessee by 83,000 (all these numbers are rounded to the nearest 1,000). Percentagewise, the fastest growing states were Florida (1.9%), Idaho (1.8%), South Carolina (1.7%), Texas (1.6%), South Dakota, and Montana (1.5% each). Arizona, Delaware, Georgia, North Carolina, Tennessee, and Utah all grew by more than 1 percent. The biggest losers were New York (-0.9%) Illinois (-0.8%), Louisiana (-0.8%), West Virginia (-0.6%), Hawaii (-0.5%), and Oregon (-0.4%).
Los Angeles County lost more than 90,000 residents, more than any other county. This was followed by Cook County, Illinois, which lost 68,000. Queens, Kings (Brooklyn), and the Bronx all lost 40,000 to 50,000, and Richmond County (Staten Island) lost about 2,000, but surprisingly New York (Manhattan) grew by more than 17,000. Other counties that lost a lot of residents included Philadelphia (-22,000), Wayne (Detroit, -16,000), Santa Clara (San Jose, -16,000), and Alameda (Oakland, -15,000). Allegheny (Pittsburgh), Cuyahoga (Cleveland), and Multnomah (Portland) counties all lost more than 10,000 people.
Maricopa County (Phoenix) gained 57,000 residents, Harris County (Houston) gained 46,000, Collin County (part of Dallas metro area) gained 44,000, and Denton County (also part of Dallas metro area) gained 33,000. Most other counties that saw big gains were in Florida, North Carolina, or Texas, but Riverside County, California grew by close to 21,000.
These numbers are only estimates, and not everyone agrees with them. For example, the Portland State University Population Research Center estimates that Oregon gained 15,000 residents in 2022, while the Census Bureau estimates that it lost 16,000.
Housing prices influenced population changes, but they are clearly not the only factor as housing is very affordable in Louisiana and West Virginia. Density may play at least as much of a role as housing prices. Though Manhattan grew by 17,000, this was after losing 81,000 between 2020 and 2021, so the 17,000 were just filling in vacant spaces left by people fleeing the city during the pandemic.
In general, people moved from places they didn’t like, whether due to high prices, density, or other factors, to places they liked. What has changed from the past is that job locations are less relevant.
Update: Density supporters are already twisting the data in this census report to claim that “people have stopped fleeing cities.” They note that Manhattan grew in 2022, but don’t mention that Brooklyn, Queens, and the Bronx all continued to shrink. Nor do they mention that Los Angeles and Chicago all declined, and about San Francisco they claim that, since it didn’t decline in 2022 as much as it did in 2021, it must be growing. They also point to growth in Dallas without mentioning that its suburbs grew faster. The reality is that, Manhattan’s slight recovery notwithstanding, people are leaving dense areas.
This piece first appeared at The Antiplanner.
Randal O'Toole, the Antiplanner, is a policy analyst with nearly 50 years of experience reviewing transportation and land-use plans and the author of The Best-Laid Plans: How Government Planning Harms Your Quality of Life, Your Pocketbook, and Your Future.
Credits: U.S. Map, courtesy Antiplanner; lead graph, from U.S. Census Bureau data.


