
It is well known that the largest percentage losses in house prices occurred early in the housing bubble in inland California, Sacramento and Riverside-San Bernardino, Las Vegas and Phoenix. These were the very southwestern areas that housing refugees fled to in search of less unaffordable housing in California’s coastal metropolitan areas (Los Angeles, San Francisco, San Diego and San Jose).
Yet now the prices in these hyper-expensive markets are beginning to fall. Once considered widely immune from the severe housing slump, the San Francisco area now has muscled its way into the list of biggest losers. The newly published first quarter 2009 house price data from the National Association of Realtors indicates that prices are down 52.5 percent from the peak. Only Riverside-San Bernardino and Sacramento have experienced greater losses out of the 49 metropolitan areas with a population of more than 1,000,000 for which there is data (see table below). Other metropolitan areas that have seen prices drop more than 50 percent include Phoenix, Las Vegas and, for very different reasons, that rustbelt sad sack, Cleveland.
| Table 1 | |||
| Median House Price Loss: Metropolitan Areas Over 1,000,000 Population | |||
| Rank | Metropolitan Area |
Median House Price % Loss from 2000-2008 Peak
|
Median House Price Loss from 2000-2008 Peak
|
| 1 | Riverside-San Bernardino, CA | -57.7% | $235,600 |
| 2 | Sacramento, CA | -56.5% | $219,600 |
| 3 | San Francisco, CA | -52.5% | $444,800 |
| 4 | Phoenix, AZ | -51.9% | $139,200 |
| 5 | Cleveland, OH | -51.5% | $74,300 |
| 6 | Las Vegas, NV | -51.3% | $163,800 |
| 7 | Los Angeles, CA | -48.8% | $289,400 |
| 8 | San Jose, CA | -48.0% | $415,000 |
| 9 | San Diego, CA | -47.5% | $291,900 |
| 10 | Miami-West Palm Beach, FL | -47.3% | $185,200 |
| 11 | Orlando, FL | -43.1% | $117,200 |
| 12 | Tampa-St. Petersburg, FL | -42.2% | $98,800 |
| 13 | Washington, DC-VA-MD-WV | -37.3% | $165,900 |
| 14 | St. Louis, MO-IL | -35.8% | $56,300 |
| 15 | Chicago, IL | -35.2% | $100,900 |
| 16 | Atlanta, GA | -34.4% | $60,600 |
| 17 | Memphis, TN-MS-AR | -34.0% | $49,400 |
| 18 | Providence, RI-MA | -33.6% | $102,600 |
| 19 | Boston, MA-NH | -32.5% | $140,200 |
| 20 | Cincinnati, OH-KY-IN | -28.6% | $42,600 |
| 21 | Richmond, VA | -27.9% | $66,800 |
| 22 | Indianapolis, IN | -26.6% | $34,300 |
| 23 | Minneapolis-St. Paul, MN-WI | -25.9% | $60,800 |
| 24 | Columbus, OH | -24.5% | $38,400 |
| 25 | Denver, CO | -24.1% | $61,200 |
| 26 | Birmingham, AL | -23.2% | $39,300 |
| 27 | Jacksonville, FL | -22.4% | $44,600 |
| 28 | Charlotte, NC-SC | -22.1% | $48,700 |
| 29 | New York, NY-NJ-PA | -21.9% | $104,700 |
| 30 | Virginia Beach-Norfolk, VA | -21.2% | $54,000 |
| 31 | Kansas City, MO-KS | -20.4% | $32,400 |
| 32 | Seattle, WA | -20.1% | $79,500 |
| 33 | Pittsburgh, PA | -19.0% | $24,300 |
| 34 | Hartford, CT | -17.7% | $47,800 |
| 35 | Portland, OR-WA | -17.0% | $51,100 |
| 36 | Baltimore, MD | -16.3% | $47,900 |
| 37 | New Orleans, LA | -15.6% | $27,800 |
| 38 | Philadelphia, PA-NJ-DE-MD | -15.2% | $37,000 |
| 39 | Louisville, KY-IN | -15.1% | $21,500 |
| 40 | Rochester, NY | -14.5% | $18,000 |
| 41 | Houston, TX | -13.6% | $21,800 |
| 42 | Dallas-Fort Worth, TX | -13.5% | $21,100 |
| 43 | Buffalo, NY | -13.1% | $15,000 |
| 44 | Milwaukee, WI | -12.1% | $27,800 |
| 45 | Salt Lake City, UT | -6.7% | $16,500 |
| 46 | San Antonio, TX | -6.2% | $9,800 |
| 47 | Austin, TX | -6.1% | $11,900 |
| 48 | Raleigh, NC | -5.3% | $12,600 |
| 49 | Oklahoma City, OK | -3.3% | $4,500 |
Cleveland, the newest entrant to the “over 50” club, fell largely because of the collapse of its industrial economy. It remains the only one of the thirteen mega-losers without prescriptive land use policies (sometimes called “smart growth”), which raise house prices by rationing land for development and imposing more stringent regulatory requirements. Cleveland illustrates a point made in a previous commentary: that the huge house price losses in the housing downturn have spread broadly from the original metropolitan areas that precipitated Meltdown Monday, the Lehman Brothers bankruptcy on September 15, and the Panic of 2008.
During Phase I of the housing downturn (through September 2008), the largest losses were concentrated in the “Ground Zero” markets of California, Florida, Las Vegas, Phoenix and Washington, DC. In each of these 11 markets, median house prices dropped at least 25 percent, with per house over $100,000 except in Tampa-St. Petersburg during Phase I. These markets, all with more prescriptive planning, accounted for nearly 75 percent of the gross house value loss in the nation, with other more prescriptive markets accounting for another 20 percent. The more responsive markets, where land use regulation follows more traditional market-driven lines, accounted for slightly more than 5 percent of the loss.
The Chart below and Table 1 in The Housing Downturn in the United States: 2009 First Quarter Update financial collapse, however, now has spread the losses much more generally. In Phase II, the Ground Zero markets represented 44 percent of the loss, the other more prescriptive markets 38 percent and the more responsive markets 18 percent.
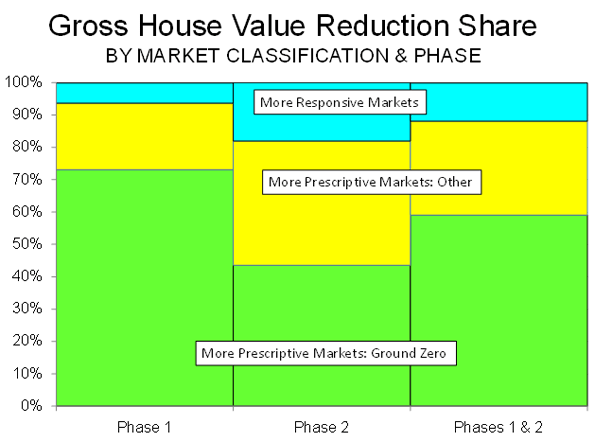
As of the first quarter of 2009, prices had dropped in all major metropolitan areas. The average per house loss in the Ground Zero markets was still the highest, at 48 percent, though the overall all loss had increased to 34 percent.
There are indications that the housing downturn may be slowing. The latest data indicates that the median house price increased in March, though not enough to forestall a loss in the first quarter. Another indicator is the fact that the Median Multiple (median house price divided by median household income) has fallen to a national level of 3.1, which is slightly more than the 2.9 historic rate and well below the 4.6 peak.
The best news of all is that the Median Multiple has dropped to 3.8 in the Ground Zero markets, which is equal to the historic level and well below the peak of 7.3. In the other more prescriptive markets, the Median Multiple is at 3.5, above the 2.9 historic average but well below the peak of 4.8. In the more responsive markets, the Median Multiple has dropped to 2.6, just above the historic average of 2.5 and below the peak figure of 3.2.

Prices have fallen so much that they now stand at historic 1980 to 2000 Median Multiple levels in 18 of the 49 metropolitan areas. Critically, this includes the Ground Zero markets of Riverside-San Bernardino, Sacramento, Phoenix and Las Vegas.
Other Ground Zero markets have seen much of their price inflation whittled away, but still have a way to go. Prices need to decline $33,500 to reach the historic Median Multiple level in Los Angeles, $32,300 in Miami, $31,200 in Washington, $18,500 in San Francisco, $11,100 in San Diego and only $1,700 in Tampa-St. Petersburg.
In other markets, however, prices still have some distance to go before the historic Median Multiple is reached. The largest decrease would have to occur in New York, at $122,000, followed by Portland ($95,000), Seattle ($94,000), Baltimore ($75,000) and Salt Lake City ($74,000). Other markets, including Philadelphia, Virginia Beach, Milwaukee and Ground Zero San Jose would need to have price declines of more than $50,000 to restore their historic Median Multiples. See Table 2.
| Table 2 | |||||
| Median House Price Reduction Required to Reach Historic Price/Income Ratio (Median Multiple) | |||||
| Median House Price Reduction Required to Reach 1980-2000 Median Multiple |
Median Multiple
|
||||
| Rank | Metropolitan Area |
1980-2000 Average
|
2000-2008 Peak
|
Current (2009: 1st Quarter)
|
|
| 1 | New York, NY-NJ-PA | $122,200 | 3.9 | 7.7 | 5.8 |
| 2 | Portland, OR-WA | $94,700 | 2.7 | 5.4 | 4.4 |
| 3 | Seattle, WA | $94,400 | 3.3 | 6.2 | 4.7 |
| 4 | Baltimore, MD | $74,700 | 2.6 | 4.6 | 3.7 |
| 5 | Salt Lake City, UT | $73,800 | 2.6 | 4.3 | 3.8 |
| 6 | Philadelphia, PA-NJ-DE-MD | $61,500 | 2.4 | 4.2 | 3.4 |
| 7 | San Jose, CA | $55,400 | 4.5 | 10.2 | 5.1 |
| 8 | Virginia Beach-Norfolk, VA | $53,600 | 2.6 | 4.7 | 3.5 |
| 9 | Milwaukee, WI | $51,400 | 2.8 | 4.4 | 3.8 |
| 10 | Boston, MA-NH | $41,900 | 3.5 | 6.1 | 4.1 |
| 11 | Los Angeles, CA | $33,500 | 4.5 | 10.1 | 5.1 |
| 12 | Miami-West Palm Beach, FL | $32,300 | 3.4 | 7.0 | 4.0 |
| 13 | Jacksonville, FL | $32,000 | 2.3 | 3.6 | 2.9 |
| 14 | Washington, DC-VA-MD-WV | $31,200 | 2.9 | 5.3 | 3.3 |
| 15 | Providence, RI-MA | $29,400 | 3.1 | 5.4 | 3.6 |
| 16 | Raleigh, NC | $26,700 | 3.3 | 3.9 | 3.7 |
| 17 | Austin, TX | $20,500 | 2.8 | 3.3 | 3.2 |
| 18 | San Francisco, CA | $18,500 | 5.0 | 11.2 | 5.2 |
| 19 | Denver, CO | $18,000 | 2.9 | 4.3 | 3.2 |
| 20 | Minneapolis-St. Paul, MN-WI | $15,700 | 2.4 | 3.6 | 2.6 |
| 21 | Hartford, CT | $14,300 | 3.1 | 4.2 | 3.3 |
| 22 | San Diego, CA | $11,100 | 4.9 | 9.5 | 5.1 |
| 23 | Buffalo, NY | $10,900 | 1.9 | 2.5 | 2.1 |
| 24 | Charlotte, NC-SC | $10,100 | 3.0 | 4.1 | 3.2 |
| 25 | Richmond, VA | $9,500 | 2.8 | 4.1 | 3.0 |
| 26 | Louisville, KY-IN | $8,100 | 2.4 | 3.1 | 2.6 |
| 27 | Chicago, IL | $7,800 | 2.9 | 4.8 | 3.0 |
| 28 | San Antonio, TX | $5,200 | 3.0 | 3.3 | 3.1 |
| 29 | Orlando, FL | $4,000 | 2.9 | 5.2 | 3.0 |
| 30 | Pittsburgh, PA | $3,400 | 2.1 | 2.8 | 2.2 |
| 31 | Tampa-St. Petersburg, FL | $1,700 | 2.8 | 4.7 | 2.8 |
| Las Vegas, NV | At or Below | 3.4 | 5.3 | 2.7 | |
| Riverside-San Bernardino, CA | At or Below | 3.7 | 6.6 | 3.0 | |
| Sacramento, CA | At or Below | 3.6 | 5.6 | 2.8 | |
| Memphis, TN-MS-AR | At or Below | 3.0 | 3.1 | 2.0 | |
| New Orleans, LA | At or Below | 3.1 | 3.3 | 2.8 | |
| Phoenix, AZ | At or Below | 2.8 | 4.7 | 2.4 | |
| Atlanta, GA | At or Below | 2.4 | 3.1 | 2.0 | |
| Birmingham, AL | At or Below | 3.0 | 3.5 | 2.7 | |
| Cincinnati, OH-KY-IN | At or Below | 2.3 | 2.8 | 2.0 | |
| Cleveland, OH | At or Below | 2.2 | 2.8 | 1.4 | |
| Columbus, OH | At or Below | 2.4 | 2.9 | 2.2 | |
| Dallas-Fort Worth, TX | At or Below | 2.7 | 2.7 | 2.4 | |
| Houston, TX | At or Below | 2.5 | 2.9 | 2.5 | |
| Indianapolis, IN | At or Below | 2.1 | 2.3 | 1.7 | |
| Kansas City, MO-KS | At or Below | 2.5 | 2.9 | 2.3 | |
| Oklahoma City, OK | At or Below | 2.8 | 2.9 | 2.8 | |
| Rochester, NY | At or Below | 2.2 | 2.4 | 2.0 | |
| St. Louis, MO-IL | At or Below | 2.2 | 2.9 | 1.9 | |
| Median Multiple: Median house price divided by median household income. | |||||
These price reductions may or may not occur in over-valued metropolitan areas like New York, Portland and Seattle, all of which are also experiencing serious increases in unemployment. However, given the pervasive evidence that the market is returning to the vicinity of historic price ratios, it would not be surprising if significant price reductions happen in these metropolitan areas, which were previously seen and saw themselves as immune to the fallout that hit the less well-regarded ground zero markets.
Additional information is available in:
The Housing Downturn in the United States: 2009 First Quarter Update
Wendell Cox is a Visiting Professor, Conservatoire National des Arts et Metiers, Paris. He was born in Los Angeles and was appointed to three terms on the Los Angeles County Transportation Commission by Mayor Tom Bradley. He is the author of “War on the Dream: How Anti-Sprawl Policy Threatens the Quality of Life.”


There are indications that
There are indications that the housing downturn may be slowing.
http://www.musclefactor-x.blogspot.com
I never read such beautiful
I never read such beautiful article before. This article is very unique and full of surprise. I nver read this kind of article that is straighforward when regarding to the topic.
phen375 reviews
I never read such beautiful
I never read such beautiful article before. This article is very unique and full of surprise. I nver read this kind of article that is straighforward when regarding to the topic. Very intense kind of writing. Keep up the good and unique article writing. - service genset
I didn't say it didn't, to
I didn't say it didn't, to be fair. I was just disappointed to find so much stomach-meat on the nachos was all. - Hotel di Semarang Indonesia
It is well known that the
It is well known that the largest percentage losses in house prices occurred early in the housing bubble in inland California, anime hd online Sacramento and Riverside-San Bernardino, Las Vegas and Phoenix. These were the very southwestern areas that housing refugees fled to in search of less unaffordable housing in California’s coastal metropolitan areas (Los manga read Angeles, San Francisco, San Diego and San Jose).
Yet now the prices in these hyper-expensive markets are beginning to fall. Once considered widely immun
It is well known that the
It is well known that the largest percentage losses in house prices occurred early in the housing bubble in inland California, Sacramento and Riverside-San Bernardino, Las Vegas and Phoenix. These were the very southwestern areas that housing refugees watch hunter x hunter fled to in search of less unaffordable housing in California’s coastal metropolitan areas (Los Angeles, San Francisco, San Diego and San Jose).
Yet now the prices in these hyper-expensive markets are beginning to fall. Once considered Ansatsu Kyoushitsu widely immun
It is well known that the
It is well known that the largest manga online percentage losses in house prices occurred early in the housing bubble in inland California, Sacramento and Riverside-San Bernardino, Las Vegas and Phoenix. These were the very southwestern areas that housing refugees fled to in search of less unaffordable anime online housing in California’s coastal metropolitan areas (Los Angeles, San Francisco, San Diego and San Jose).
Yet now the prices in these hyper-expensive markets are beginning to fall. Once considered widely immun
Hey, Today is 1st day I have
Hey, Today is 1st day I have read your blog but believe me you are ready good in writing. Took me time to read all the comments, but I really enjoyed the article. - cara memperbesar alat vital
This site is excellent and
This site is excellent and so is how the subject matter was explained. I also like some of the comments too.Waiting for next post. - klink Chlorophyll
I do wish there were more
I do wish there were more people like you around on the interwebs. This info is very good for me.This site is awesome. My spouse and i constantly come across a new challenge & diverse in this article. - sewa sound system murah