Uncategorized
Information Sector Growth Nodes, by number of jobs, 2000 - 2007
by Mark Schill 07/17/2008
Image:

Source:
U.S. Bureau of Labor Statistics, Current Employment Statistics
»
- Login to post comments
Information Sector Growth Nodes, by percent, 2000 - 2007
by Mark Schill 07/17/2008
Image:

Source:
U.S. Bureau of Labor Statistics, Current Employment Statistics
»
- Login to post comments
U.S. Information Sectors, 1991 - 2008
by Mark Schill 07/17/2008
Image:

Source:
U.S. Bureau of Labor Statistics Current Employment Statistics
»
- Login to post comments
Fastest Growing Manufacturing Centers, by number of jobs, 2000 - 2007
by Mark Schill 07/14/2008
Image:

Notes:
Areas are MSAs among 313 Metro Areas with data
Source:
U.S. Bureau of Labor Statistics Current Employ
»
- Login to post comments
Manufacturing Growth Centers, by percent growth, 2000-2007
by Mark Schill 07/14/2008
Image:
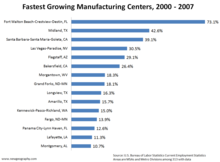
Notes:
Areas are MSAs, highest growth rates among 313 metro areas with data
Source:
U.S. Bureau of Labor Statistics Current Employment Statistics
»
- Login to post comments
Fastest Growing Cities of 100,000 - 300,000 Population, 2000 - 2007
by Mark Schill 07/10/2008
Image:

Notes:
Areas are city portions of larger metropolitan area
Source:
U.S. Census Population Estimates Program
»
- Login to post comments
Fastest Growing Cities over 300,000 Population, 2000 - 2007
by Mark Schill 07/10/2008
Image:

Notes:
Areas are city portions of larger metropolitan area
Source:
U.S. Census Population Estimates Program


