Image:

Source:
US Bureau of Labor Statistics Current Employment Statistics
UncategorizedTotal Employment, New York City, Chicago, San Francisco
by Mark Schill 09/16/2008
Image: Source: US Bureau of Labor Statistics Current Employment Statistics »
Finance Industry Employment, New York City, Chicago, San Francisco
by Mark Schill 09/16/2008
Image: 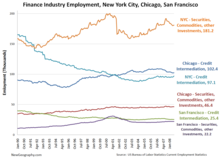 Source: US Bureau of Labor Statistics Current Employment Statistics »
Job Growth in the Great Plains States, 1971 - 2007
by Mark Schill 09/15/2008
Image:  Source: U.S. Bureau of Labor Statistics Current Employment Statistics »
Finance and Insurance Employment in Charlotte Metropolitan Area, 1990-2008
by Mark Schill 09/15/2008
Image:  Notes: Finance Sector employment in the Charlotte region has nearly tripled since 1990. Source: U.S. Bureau of Labor Statistics Current Employment Statistics »
2004 Presidential Vote by Household Income
by Richard Morrill 09/14/2008
Image: 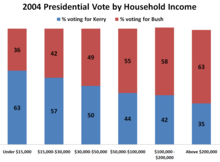 »
Highly concentrated industries in Wisconsin Rapids, Wi
by Mark Schill 09/09/2008
Image: 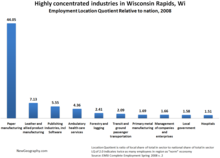 Notes: Employment Location Quotient Relative to nation, 2008
Location Quotient is ratio of local share of total in sector to national share of total in sector
LQ of 2.0 indicates twice as many employees in region as "norm" economy
Source: Source: EMSI Complete Employment Spring 2008 v. 2
»
U.S. Paper Industry Employment Since 1990
by Mark Schill 09/09/2008
Image:  Source: Praxis Strategy Group Analysis of BLS Current Employment Statistics
»
Family Income Group Concentration, 2006
by Mark Schill 09/09/2008
Image: 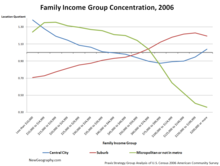 Source: Praxis Strategy Group Analysis of U.S. Census 2006 American Community Survey
»
Median Monthly Housing Costs for Owner-Occupied Housing Units With a Mortgage, 2006
by Mark Schill 09/08/2008
Image:  Source: Praxis Strategy Group Analysis of U.S. Census 2006 American Community Survey
Share of Population in Small Cities and Non-Metro Areas in Battle Ground States - 2008 Election
by Mark Schill 09/08/2008
Image:  Source: Praxis Strategy Group Analysis of U.S. Census Population Estimates Program
»
|
Subscribe to NG ArticlesFeatured Content
The Coming of Neo-Feudalism
Infinite Suburbia
Books
Authored by Aaron Renn, The Urban State of Mind: Meditations on the City is the first Urbanophile e-book, featuring provocative essays on the key issues facing our cities, including innovation, talent attraction and brain drain, global soft power, sustainability, economic development, and localism. Popular ContentRecommended Books
Blogroll and Partner SitesUser login |


