
A few weeks ago, Eamon Moynihan reviewed economic research on cost of living by state in a newgeography.com article. The results may seem surprising, given that some of the states with the highest median incomes rated far lower once prices were taken into consideration. The dynamic extends to the nation’s 51 metropolitan areas with more than 1,000,000 population (See Table).
There is a general perception that the most affluent metropolitan areas are on the east coast and the west coast. Indeed, 8 of the 10 metropolitan areas with the highest nominal per capita income in 2006 were on the two coasts. These included San Francisco, San Jose and Seattle on the west coast and Washington, Boston, New York, Hartford and Philadelphia on the east coast. Middle-America is represented by Denver and Minneapolis-St. Paul. However, as anyone who has lived on the coasts and Middle America knows, a dollar in New York or San Francisco does not buy nearly as much as a dollar in Dallas-Fort Worth or Cincinnati.
| Per Capita Income: Purchasing Power Parity | ||||
| US Metropolitan Areas over 1,000,000 Population | ||||
| 2006 Per Capita Income | ||||
| Rank | Metroplitan Area | Purchasing Power Adjusted | Nominal | Nominal Rank |
| 1 | San Francisco | $46,287 | $57,747 | 1 |
| 2 | Washington | $45,178 | $51,868 | 3 |
| 3 | Denver | $44,798 | $44,691 | 8 |
| 4 | Minneapolis-St. Paul | $44,326 | $44,237 | 9 |
| 5 | Houston | $42,815 | $43,174 | 11 |
| 6 | Boston | $42,571 | $50,542 | 4 |
| 7 | Pittsburgh | $41,716 | $38,550 | 20 |
| 8 | St. Louis | $41,613 | $37,652 | 27 |
| 9 | Milwaukee | $41,572 | $39,536 | 19 |
| 10 | Baltimore | $41,451 | $43,026 | 12 |
| 11 | Seattle | $41,448 | $45,369 | 6 |
| 12 | Kansas City | $41,329 | $37,566 | 28 |
| 13 | Hartford | $41,104 | $44,835 | 7 |
| 14 | New Orleans | $40,935 | $40,211 | 16 |
| 15 | Philadelphia | $40,725 | $43,364 | 10 |
| 16 | Dallas-Fort Worth | $40,643 | $39,924 | 17 |
| 17 | Cleveland | $39,997 | $37,406 | 30 |
| 18 | Indianapolis | $39,843 | $37,735 | 26 |
| 19 | Chicago | $39,752 | $41,591 | 14 |
| 20 | Richmond | $39,282 | $38,233 | 22 |
| 21 | New York | $39,201 | $49,789 | 5 |
| 22 | Birmingham | $39,057 | $37,331 | 31 |
| 23 | Cincinnati | $38,691 | $36,650 | 36 |
| 24 | Nashville | $38,680 | $37,758 | 25 |
| 25 | Detroit | $38,670 | $38,119 | 24 |
| 26 | Charlotte | $38,632 | $38,164 | 23 |
| 27 | Miami | $38,555 | $40,737 | 15 |
| 28 | San Jose | $38,505 | $55,020 | 2 |
| 29 | Jacksonville | $38,413 | $37,519 | 29 |
| 30 | Louisville | $38,262 | $36,000 | 41 |
| 31 | Oklahoma City | $38,156 | $35,637 | 42 |
| 32 | Las Vegas | $37,691 | $38,281 | 21 |
| 33 | Salt Lake City | $37,381 | $35,145 | 45 |
| 34 | San Diego | $37,358 | $42,801 | 13 |
| 35 | Rochester | $37,066 | $36,179 | 38 |
| 36 | Columbus | $37,058 | $36,110 | 39 |
| 37 | Atlanta | $36,691 | $36,060 | 40 |
| 38 | Memphis | $36,501 | $35,470 | 44 |
| 39 | Tampa-St. Petersburg | $36,260 | $35,541 | 43 |
| 40 | Portland | $36,131 | $36,845 | 35 |
| 41 | Buffalo | $36,091 | $33,803 | 48 |
| 42 | Norfolk (Virginia Beach metropolitan area) | $35,418 | $34,858 | 46 |
| 43 | Raleigh | $35,087 | $37,221 | 32 |
| 44 | San Antonio | $34,913 | $32,810 | 50 |
| 45 | Providence | $34,690 | $37,040 | 34 |
| 46 | Austin | $33,832 | $36,328 | 37 |
| 47 | Phoenix | $33,809 | $34,215 | 47 |
| 48 | Sacramento | $32,750 | $37,078 | 33 |
| 49 | Los Angeles | $32,544 | $39,880 | 18 |
| 50 | Orlando | $32,095 | $33,092 | 49 |
| 51 | Riverside-San Bernardino | $25,840 | $27,936 | 51 |
| Source: | ||||
| http://www.bea.gov/scb/pdf/2008/11%20November/1108_spotlight_parities.pdf | ||||
Purchasing Power Parity: Things change rather dramatically when purchasing power is factored in. Some years ago, international economic organizations, such as the Organization for Economic Cooperation and Development, the World Bank and the International Monetary Fund began using costs of living by nation to compare national economic performance, rather than currency exchange rate. This practice, called “purchasing power parity” is based upon the recognition that there may be substantial differences in the cost of living between nations.
This can be illustrated by comparing Switzerland and the United States. For years, Switzerland has had a higher per capita GDP than the United States on an exchange rate basis. Switzerland’s gross domestic product per capita was $53,300 in 2006, nearly 30% above that of the United States ($42,000). However price levels in Switzerland are so high that incomes do not go nearly as far as the exchange rate would suggest. Once adjusted for purchasing power parity, the Swiss GDP per capita in 2006 drops to $39,000, well below that of the United States. Much of the difference has to do with regulation. The more liberal economy of the United States produces a lower cost economy than in Switzerland, or for that matter most of Western Europe. The US economic advantage would be even greater measured on a household basis, since US households include nearly 10% more members (generally children) than those in Western Europe.
The same concept was applied by the Department of Commerce Bureau of Economic Analysis researchers in their review of purchasing power parities between US metropolitan areas in 2006. When purchasing power is factored in, five of the top metropolitan areas in nominal per capita income (not adjusted for purchasing power) drop out and are replaced by other metropolitan areas rarely thought of as among the nation’s most affluent.
Among the three west coast nominal leaders, San Francisco remains as #1, in both nominal and purchasing power adjusted per capita income. Seattle dropped from 6th to 11th position. However, the real surprise is San Jose, which dropped from 2nd position to 28th.
The east coast regions ranked among the top 10 metropolitan areas in nominal income also were decimated by their high costs, with only Washington (which rose from 3rd to 2nd) and Boston (which fell from 4th to 6th) remaining. New York fell from 5th to 21st, Hartford from 7th to 13th and Philadelphia from 10th to 16th.
The two non-coastal metropolitan areas in the nominal top 10 remain, with Denver rising from to 3rd and Minneapolis-St. Paul rising from 9th to 4th.
It can be argued that Middle-America replaced the five metropolitan areas dropping out of the top ten. Houston, long one of the most disparaged metropolitan areas among urbanists, occupies the 5th position (compared to its 11th ranking in the nominal list). Three of the new entrants are confirmed members of the Rust Belt: Pittsburgh (7th), St. Louis (8th) and Milwaukee (9th). Finally, there is a new east coast entrant, blue-collar Baltimore (10th).
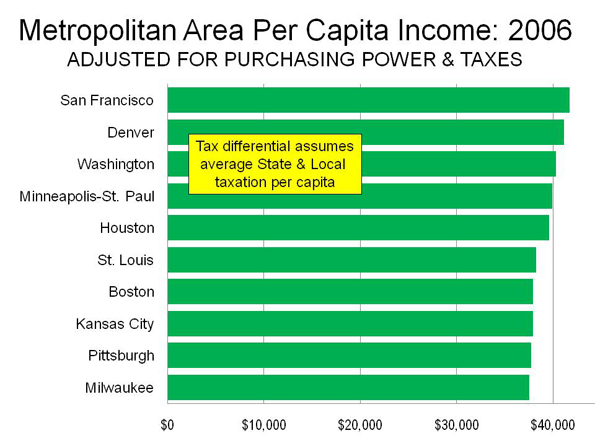
The Impact of Taxes: But that is just the beginning. Taxes also diminish the purchasing power of households. Unfortunately, there is virtually no readily available information on state and local taxation by metropolitan area. There is, however state and local government taxation data at the state level. If it is assumed that this data is representative of metropolitan differences (weighted proportionately by state in multi-state metropolitan areas), there would be changes in rank among the top 10. Denver would displace Washington in the number two position, closing more than one-half the gap with San Francisco. Even more surprisingly, St. Louis would move ahead of both Boston and Pittsburgh to rank 6th. Kansas City would leap over #11 Seattle, Baltimore, Milwaukee and Pittsburgh to rank 8th, trailing #7 Boston by $25, not much more than the price of a Red Sox standing room ticket. Pittsburgh would occupy the #9 position and Milwaukee #10 (See Figure).
More than Housing: The largest differences in purchasing power stem from housing, with east coast and west coast metropolitan areas having generally higher housing costs. As a result of the housing bust and the larger house price drops in those areas, purchasing power adjusted incomes could recover relative to those of Middle America. However, the high cost of living on the east and west coasts extend to more than housing prices. Generally, according to proprietary (and for sale) ACCRA cost of living data, the west coast and east coast metropolitan areas have higher costs of living even without housing. These differences are largely in grocery costs, which probably reflects the anti-big box store planning regulations and politics that exist in many of these areas. Grocery costs in the more affluent middle-American metropolitan areas tend to be lower.
Other Surprises: Outside the top 10 most affluent metropolitan areas, there are other surprises. Urban planning favorite Portland ranks 40th, just above Buffalo. Rust Belt Cleveland ranks 17th, a few positions above New York. Kansas City, with its highly decentralized civic architecture, ranks 12th, just behind Seattle. Indianapolis (17th) is more affluent than Chicago (18th) and both are more affluent than New York.
Five of the bottom 10 metropolitan areas are in the south, including Virginia Beach, Raleigh, Austin, San Antonio and Orlando. But perhaps the biggest surprise of all is that four of the five lowest ranking metropolitan areas are in the southwest: Phoenix (47th), Sacramento (48th), Los Angeles (49th) and Riverside-San Bernardino (51st).
The Dominance of Middle America: But among the 10 most affluent metropolitan areas in the nation, six or seven may be counted as Middle-America (depending on how Baltimore is classified). Only three are from the original group that supplies 8 of the top metropolitan areas when purchasing power is not considered.
Related articles:
Gross Domestic Product per Capita, PPP: World Metropolitan Regions
Gross Domestic Product per Capita, PPP: China Metropolitan Regions
Photograph: Pittsburgh
Wendell Cox is a Visiting Professor, Conservatoire National des Arts et Metiers, Paris. He was born in Los Angeles and was appointed to three terms on the Los Angeles County Transportation Commission by Mayor Tom Bradley. He is the author of “War on the Dream: How Anti-Sprawl Policy Threatens the Quality of Life.”


SEO is the process which
SEO is the process which cultivates your website in a manner that makes google give top ranking to your website on the google listing page for the relevant keyword and key phrase search. european car brands
You can also download free
You can also download free or low-cost e-books online that should be able to provide you a wise decision of how to promote your item. Insidious Chapter 3
Yes i am totally agreed with
Yes i am totally agreed with this article and i just want say that this article is very nice and very informative article.I will make sure to be reading your blog more. You made a good point but I can't help but wonder, what about the other side? !!!!!!THANKS!!!!!!
microsoft word resume template
I just couldn't leave your
I just couldn't leave your website before telling you that I truly enjoyed the top quality info you present to your visitors? Will be back again frequently to check up on new posts.
https://www.rebelmouse.com/thedesiresystem
This is very educational
This is very educational content and written well for a change. It's nice to see that some people still understand how to write a quality post!
Galt Villas Motel Fort Lauderdale
Thanks for taking the time
Thanks for taking the time to discuss this, I feel strongly that love and read more on this topic. If possible, such as gain knowledge, would you mind updating your blog with additional information? It is very useful for me.
simply energy
A few weeks ago, Eamon
A few weeks ago, Eamon Moynihan reviewed economic research on cost of living by state in a newgeography.com article. The results may seem surprising, given that some of the states with the highest median incomes rated far lower once prices were read Beelzebub manga taken into consideration. The dynamic extends to the nation’s 51 metropolitan areas with more than 1,000,000 population (See Table).
There is a general perception that the most affluent metropolitan areas are on the east coast and Fairy Tail watch the west coast. Indeed,
Chesapeake Jobs
"Chesapeake Jobs has been created keeping in view of the IT-professionals. This site will help you ""Professionals"" to quickly and efficiently locate many opportunities that exist.It's user friendly tool to help you match your own Specifications, Qualifications and Requirements."
just sayin'
I can see Baltimore's rust belt characterization, but it is not "Middle America". (It is on the Chesapeake Bay, which connects to the Atlantic, and it is 45 minutes from DC. No one would call D.C. "Middle America" a.k.a. the midwest.)
Sorry for the quibble. This is intersting data.
America's heartland's future? Increasingly bleak
Culled from:
http://www.guardian.co.uk/world/2009/nov/01/detroit-michigan-economy-rec...
"In cities across America a collapsed manufacturing base has been further damaged by the recession and has led to conditions of dire unemployment and the creation of an underclass. Richard Feldman, a former Detroit car-worker and union official turned social activist, sees disaster across the country. Sitting in a downtown Detroit bar, he lists a grim roll call of cities across America where decline is hitting hard and where the official end of the recession will make little difference."
David Parvo
Most Senior Fellow
THE Placemaking Institute
http://placemakinginstitute.wordpress.com