
The just released 6th Annual Demographia International Housing Affordability Survey shows some improvement in housing affordability, especially in the United States and Ireland but a continuing loss of housing affordability, especially in Australia.
The Survey, co-authored by Hugh Pavletich of Performance Urban Planning, covers 272 metropolitan markets in 6 nations (the United States, the United Kingdom, Canada, Australia, Ireland and New Zealand). The Survey estimates housing affordability using the “Median Multiple,” which is the median house price divided by the median household income. As recently as the late 1980s, the Median Multiple virtually everywhere was 3.0 or below. Over the past 10 to 20 years, however, the Median Multiple has risen worryingly in all major markets of the United Kingdom, Australia, New Zealand and Ireland and in some markets in the United States and Canada.
Housing affordability is rated on a four category scale, from “affordable” to “severely unaffordable” (Table 1).
|
Table 1 |
|
|
Housing Affordability Rating |
Median Multiple |
|
Severely Unaffordable |
5.1 & Over |
|
Seriously Unaffordable |
4.1 to 5.0 |
|
Moderately Unaffordable |
3.1 to 4.0 |
|
Affordable |
3.0 or Less |
Affordable Markets: The Survey found affordable markets in both the United States and Canada. This included fast-growing markets, such as Atlanta, Dallas-Fort Worth and Houston, which have had the highest underlying demand of any metropolitan areas with more than 5,000,000 population in the high-income world. It also includes the “Rust Belt” metropolitan areas, such as Detroit, which has experienced severe declines in demand in the Great Recession. There were also a number of additional metropolitan areas that are neither fast growing nor in dire economic straits, such as Indianapolis, Kansas City and Cincinnati (Table 2).
| Table 2 | |||
| Affordable Major Markets: 2009: Third Quarter | |||
| Affordability Rank | Nation | Market | Median Multiple |
| 1 | United States | Detroit, MI | 1.6 |
| 2 | United States | Atlanta, GA | 2.1 |
| 3 | United States | Indianapolis, IN | 2.2 |
| 4 | United States | Rochester, NY | 2.3 |
| 5 | United States | Cincinnati, OH-KY-IN | 2.4 |
| 5 | United States | Cleveland, OH | 2.4 |
| 5 | United States | Las Vegas, NV | 2.4 |
| 8 | United States | Buffalo, NY | 2.5 |
| 9 | United States | Columbus, OH | 2.6 |
| 9 | United States | Kansas City, MO-KS | 2.6 |
| 9 | United States | Phoenix, AZ | 2.6 |
| 9 | United States | Pittsburgh, PA | 2.6 |
| 9 | United States | St. Louis, MO-IL | 2.6 |
| 14 | United States | Dallas-Fort Worth, TX | 2.7 |
| 14 | United States | Jacksonville, FL | 2.7 |
| 16 | United States | Memphis, TN-AR-MS | 2.8 |
| 16 | United States | Minneapolis-St. Paul, MN-WI | 2.8 |
| 16 | United States | Louisville, KY-IN | 2.8 |
| 19 | United States | Houston, TX | 2.9 |
| 20 | United States | Oklahoma City, OK | 3.0 |
| 20 | United States | Riverside-San Bernardino, CA | 3.0 |
| 20 | United States | Tampa-St. Petersburg, FL | 3.0 |
Severely Unaffordable Markets: There were also 18 severely unaffordable markets, in five nations. The least unaffordable market was Vancouver (Canada), with a Median Multiple of 9.3. Sydney (Australia) was the second least affordable market (9.1), followed by Melbourne (8.0) and Adelaide (7.4). The most unaffordable markets also London (GLA or inside the greenbelt), with a Median Multiple of 7.1, San Francisco (7.0), New York (7.0), Perth, Australia (6.9), Brisbane, Australia (6.7), Auckland, New Zealand (6.7) and the London Exurbs (outside the greenbelt), at 6.7. Los Angeles-Orange County, which was the most unaffordable metropolitan area in the first four Surveys, remained severely unaffordable, at 5.7 (Table 3).
| Table 3 | |||
| Severely Unffordable Major Markets: Third Quarter: 2009 | |||
| Unaffordability Rank | Nation | Market | Median Multiple |
| 1 | Canada | Vancouver | 9.3 |
| 2 | Australia | Sydney | 9.1 |
| 3 | Australia | Melbourne | 8.0 |
| 4 | Australia | Adelaide | 7.4 |
| 5 | United Kingdom | London (GLA) | 7.1 |
| 6 | United States | New York, NY-NJ,-CT-PA | 7.0 |
| 6 | United States | San Francisco, CA | 7.0 |
| 8 | Australia | Perth | 6.9 |
| 9 | Australia | Brisbane | 6.7 |
| 9 | New Zealand | Auckland | 6.7 |
| 9 | United Kingdom | London Exurbs | 6.7 |
| 12 | United States | San Jose, CA | 6.4 |
| 13 | United Kingdom | Bristol-Bath | 6.1 |
| 14 | United States | San Diego, CA | 6.0 |
| 15 | United States | Los Angeles-Orange County, CA | 5.7 |
| 16 | United Kingdom | Stoke on Trent & Staffordshire | 5.3 |
| 17 | Canada | Toronto | 5.2 |
| 18 | United Kingdom | Newcastle & Tyneside | 5.1 |
Severely Unaffordable Markets: There were also 18 severely unaffordable markets, in five nations. The least unaffordable market was Vancouver (Canada), with a Median Multiple of 9.3. Sydney (Australia) was the second least affordable market (9.1), followed by Melbourne (8.0) and Adelaide (7.4). The most unaffordable markets also London (GLA or inside the greenbelt), with a Median Multiple of 7.1, San Francisco (7.0), New York (7.0), Perth, Australia (6.9), Brisbane, Australia (6.7), Auckland, New Zealand (6.7) and the London Exurbs (outside the greenbelt), at 6.7. Los Angeles-Orange County, which was the most unaffordable metropolitan area in the first four Surveys, remained severely unaffordable, at 5.7 (Table 3).
Summary by Nation: As in the five previous Surveys, there is a close relationship between housing unaffordability and categories of land use regulation. Virtually all severely unaffordable markets are characterized by “more prescriptive” land use regulation policies (also called “compact city,” “urban consolidation,” “growth management,” or “smart growth”). At the same time, the affordable markets overwhelmingly have “more responsive” land use regulation, in which new residential development is demand driven.
Australia: The most extreme housing unaffordability has evolved in Australia. Australia’s overall Median Multiple was 6.8, with a housing affordability rating of severely unaffordable. A recent Bank West report also noted the deteriorating housing affordability and indicated housing affordability was a thing of the past for “key workers.” This is a dramatic turnaround; housing had been affordable widely in Australia in the late 1980s, with a Median Multiple of under 3.0 and remained under 3.5 until the late 1990s. All but one of Australia’s 23 markets were severely unaffordable, with one being seriously unaffordable. All of Australia’s major markets (over 1,000,000 population) have strong “urban consolidation” policies that have resulted in unaffordable land on the urban fringe and a substantial decline in house construction, despite the highest national population growth rate among the surveyed nations.
Canada: Canada has an overall Median Multiple of 3.7 and is thus rated moderately unaffordable. Housing had been affordable in Canada in the late 1990s, with a Median Multiple of 3.0. Canada has 5 affordable markets and 4 severely unaffordable markets. Thirteen markets were rated moderately unaffordable, while 6 were rated seriously unaffordable. Like the United States, land use regulation is under the control of sub-national governments and thus ranges from demand driven to plan driven regimes.
Ireland: Ireland has experienced a substantial improvement in its housing affordability. Ireland has a Median Multiple of 3.7, and is rated moderately unaffordable. Housing had been affordable as late as the middle 1990s, with a Median Multiple below 3.0.
New Zealand: New Zealand’s overall Median Multiple was 5.7, for a severely unaffordable rating. Housing had been affordable in the early 1990s, with a Median Multiple of under 3.0. Five of the 8 markets were rated severely unaffordable, while 3 markets were seriously unaffordable. As in Australia, more prescriptive land use regulation is pervasive.
United Kingdom: The overall Median Multiple in the United Kingdom was 5.1, for a severely unaffordable rating. Housing had been affordable in the late 1990s, with a Median Multiple of under 3.0. Despite the recent house price declines, 19 of the 33 surveyed markets were rated severely unaffordable and 14 were rated seriously unaffordable. The connection between the UK’s housing unaffordability and its plan-driven regulation has been documented in Labour government commissioned report by Kate Barker, a member of the Monetary Policy Committee of the Bank of England.
United States: The United States is the first nation in Survey history to have achieved an overall affordable rating, with a Median Multiple of 2.9. The recent house price declines have restored national housing affordability to the below 3.0 historic norm (last achieved in the early 2000s), as the price bubble burst in many markets. There were 98 affordable markets, most of which experienced an increase in demand. There were also 58 moderately affordable markets. Even with the price decreases, however, house prices remain far above historic norms in some markets. Eight of the markets were seriously unaffordable, while 11 were severely unaffordable. Plan-driven land use regulation is in place in all of the major markets with severely unaffordable housing affordability.
Comparing Sydney, Melbourne, Dallas-Fort Worth and Atlanta
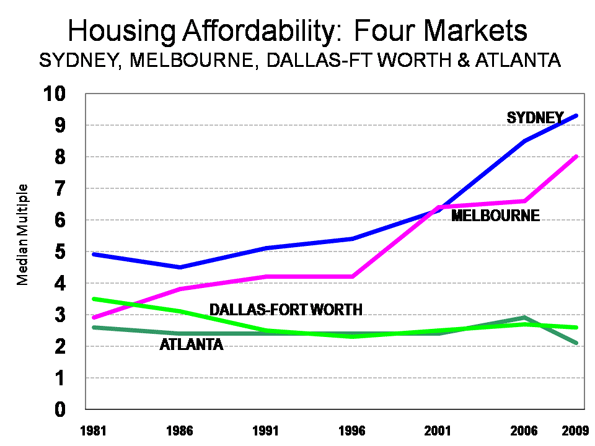
Australia: A Nation in Mortgage Stress: The Survey includes a comparison of four similar markets, Sydney and Melbourne in Australia to Dallas-Fort Worth and Atlanta in the United States. In the early 1980s, Sydney had a higher population than Dallas-Fort Worth and Melbourne had a higher population than Atlanta. Since that time, the two US metropolitan areas have passed the Australian metropolitan areas in population, having added more people than Australia’s five largest metropolitan areas combined (Sydney, Melbourne, Brisbane, Perth and Adelaide). At the same time, despite their far higher demand, housing affordability has improved in Dallas-Fort Worth and Atlanta, while it has deteriorated markedly in Sydney and Melbourne (Figure 1). During this period, “plan driven” or more prescriptive land use policies were strongly enforced in Sydney and Melbourne in contrast to the “demand driven” land use policies in place in both Atlanta and Dallas-Fort Worth.
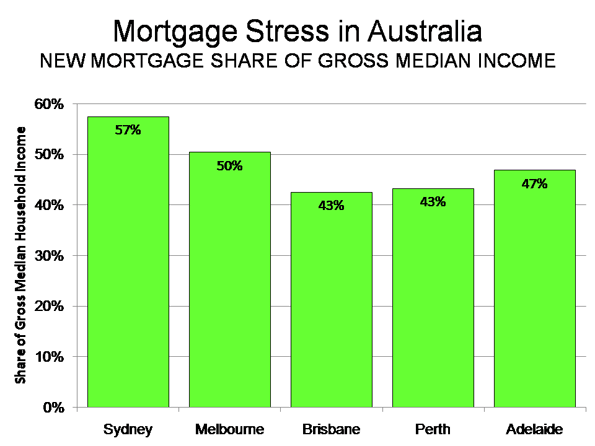
Australian government agencies consider any household paying more than 30% of its gross income for housing to be in “housing stress.” At this point, a median income household in Sydney or Melbourne would pay more 50% or more of its gross income annually for a new mortgage on a median priced house. In Brisbane, Perth and Adelaide, the figure is above 40%. (Figure 2). By comparison, in Dallas-Fort Worth and Atlanta, however, the median income household would pay less than 20% of its income for the mortgage. Not surprising then is the huge loss in housing affordability in Australia, and a decline in home ownership rates from 72% to 68% between 1995 and 2008.
Unaffordable Housing as Public Policy: It is clear that much of the cause for the differences in affordability lies with contrasting public policy approaches. The strong intervention in land markets under plan-driven regulation raises the price of land inordinately. Governments appear to have, however unwittingly, established unaffordable housing as an objective of public policy. Yet despite this, there is pressure – including from the US Obama administration, to adopt plan-driven regulation throughout the United States, despite the substantial economic disruption that such policies produced in the US bubble markets. Besides making houses unaffordable for many households, this could set the stage for even more housing bubbles in the future.
If this trend continues, future generations will pay far more for their housing than did their parents. This seems likely to stunt economic growth and job creation, while facilitating higher levels of poverty and class stratification throughout the English speaking world.
Wendell Cox is a Visiting Professor, Conservatoire National des Arts et Metiers, Paris. He was born in Los Angeles and was appointed to three terms on the Los Angeles County Transportation Commission by Mayor Tom Bradley. He is the author of "War on the Dream: How Anti-Sprawl Policy Threatens the Quality of Life.”


And this seems the
And this seems the affordability structure is only for those who leave in an premium status. Sadly, ow income earners like me always fall to renting till the very end rather than owning a new one, or if given a chance for mortgage, perhaps it will be a big slash in the pockets and end the end a possibility of foreclosure.
Archie"
works at Sliding By-Pass Door hardware http://caldwells.com/sliding-closet-door-hardware
If these are the numbers for
If these are the numbers for 2010 then I am really curious to see the numbers for 2011. The truth is that I personally became more optimistic about the real estate opportunities and I wasn't aware of the trends so far. I now afford to pay for my own mortgage and I also have a reliable home insurance Ireland, it was my best option when I decided for insurance. It looks like Ireland is on top of the game on housing.
Optimism
Phil
The Demographia survey is not a prompt for pessimism.
Neither should anyone reading it collapse into the dismal mood of Oswald Spengler anticipating the decline of the West.
That way is the way to misanthropy, and the greens have got there fast.
The Demographia survey shows how trying to understand the world in terms of left or right is futile (and has been for two decades at least). It also shows that the explanation for what is going on lies beyond demography.
It is an invitation to develop a sense of political economy, which understands that it is what people do collectively as individuals that matters in life.
Good data is necessary, but what is to be done about it?
Ian Abley
www.audacity.org
Rust Belt property prices
One thing that hits me about this report, is that the "Rust Belt" in the USA now has median multiples under 2.0; yet there are areas of Britain that have had much worse problems, and for longer, yet house prices remain seriously unaffordable.
Ian Abley's pessimism is well founded, I am sad to say, and not just for his own country. Some country needs to lead the way on this. I am picking Australia. There are a myriad of policy areas where there is still hope for Australia, whereas the country of Winston Churchill is just too far eroded by the cancer of political correctness and Green and leftwing taboos.
The zones of sanity that reach across the South and Centre of the USA (pretty much goes along with their committal to Christianity, I suggest) need to be sustained for the sake of humanity, because California and the "progressive" States have long since lost the old US "shining city on a hill" character.
The Green poison, and the mass inability, even on the part of the seemingly most intelligent people, to discern the damage that the Green poison is responsible for in our lands and societies, is a sign of the decadent end phases of our civilisation.
CHINA CRASH!!! SHANGHAI 60 & BEIJING AT 75!!!! BURN & DIE!
www.johnjasonchun.com
OK, WE ALL KNOW CHINA IS OVER HEATED, STOCKS ARE TOO HOT 2 TOUCH!
OK, NOW THE REAL ESTATE, LAST NUMBERS FOR BEIJING 75 AND SHANGHAI 60!
THAT MEANS THE AVERAGE HOME PURCHASE IS 75X THE ANNUAL INCOME OF A REGULAR CITIZEN! NOT 2 TO 9 BUT 75!!!! WTF!!!
AND SHANGHAI? WELL IT'S 60X THAT ANNUAL INCOME OF A CITIZEN!
TALKING ABOUT OVER HEATED, IT'S LIKE WHITE HOT STEEL!
The financial crisis and the
The financial crisis and the pitfall of the real estate market had a major effect on the out turn of the housing affordability survey. USA and Canada were the most affected countries by the real estate bubble that is why people are more likely to find an apartment that's affordable in one of these countries. The Australian continent on the other side, was among the least affected and it's housing affordability is still low.
Kate Barker refused to remove the planning containment
Wendell
As ever an excellent survey.
But here in Britain the findings are rather depressing. In no region are we "affordable" even after the supposed "house price crash", and price inflation is revived by the Bank of England's (yet to be paid for) rescue of the financial sector. Household incomes and house prices have parted company so that all political talk here of a return to affordability is nonsense.
You are too kind to Kate Barker at the Bank of England. She gave into poltical pressure at the time of her two reports - four reports actually if you count the two consultation papers - and backed the planning system's containment of house building, notably in London and the wider economic South East.
The setting up of the National Housing and Planning Advice Unit under former BOE Monetary Policy Committee member Stephen Nickell has done nothing to argue for developable land supply. He just measures how wages are inadequate compared to housing costs.
The election is coming here. No political party has the first clue about how to address housing unaffordability. They are only grateful that house price inflation has returned, and that no one is really complaining. The Council of Mortgage Lenders are certainly happy with the result of "Quantative Easing", and the continued national denial of housing development rights to British farmers.
The BOE might not like the fact that they can't raise base interest rates without the predicament becoming more painful, but Adam Posen at the MPC is getting ready alternative ways for the Treasury to rake in "capital gains" as a result of the house price inflation they have encouraged.
Well done on the survey. I hope no other country follows the British lead to the lethargic state of planning sustained universal housing unaffordability. I know Hugh believes affordability can be reintroduced by better management. In Britain no reform will suffice to restore affordability, and we've had constant planning reform since 1947.
Ian Abley
www.audacity.org