
The city of Seattle is an exceptional place. The 2010 census figures on race, ethnicity and age confirm this reputation. The main story from the census findings is the continued gentrification of Seattle, with displacement of minorities and the less affluent out of the center of the city, especially to south King county and Pierce county. The city core is becoming whiter, while the edges and suburbs, north and east as well as south are becoming far more diverse.
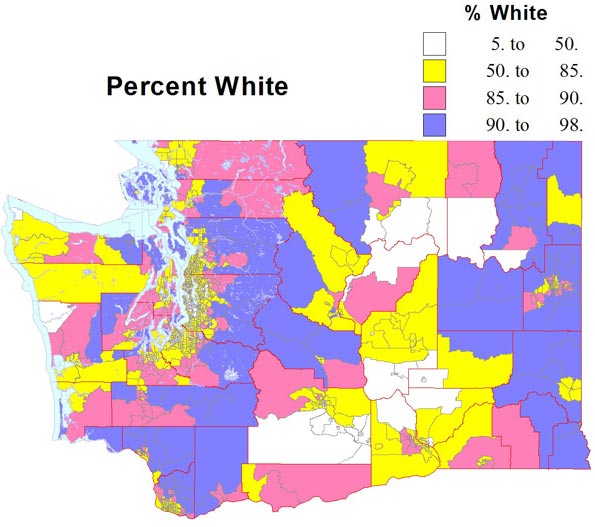
A second part of the story is the overall increase in the minority population, both statewide and in central Puget Sound. I present six maps, the first four showing the census tracts with the highest shares of Black, Asian, Native American, Latino, and those with two or more races. The last two show change in the share of all minorities (or of whites, looking at it from that point of view) for the state and for the greater Seattle area, a remarkable summary of the new face of the metropolis.
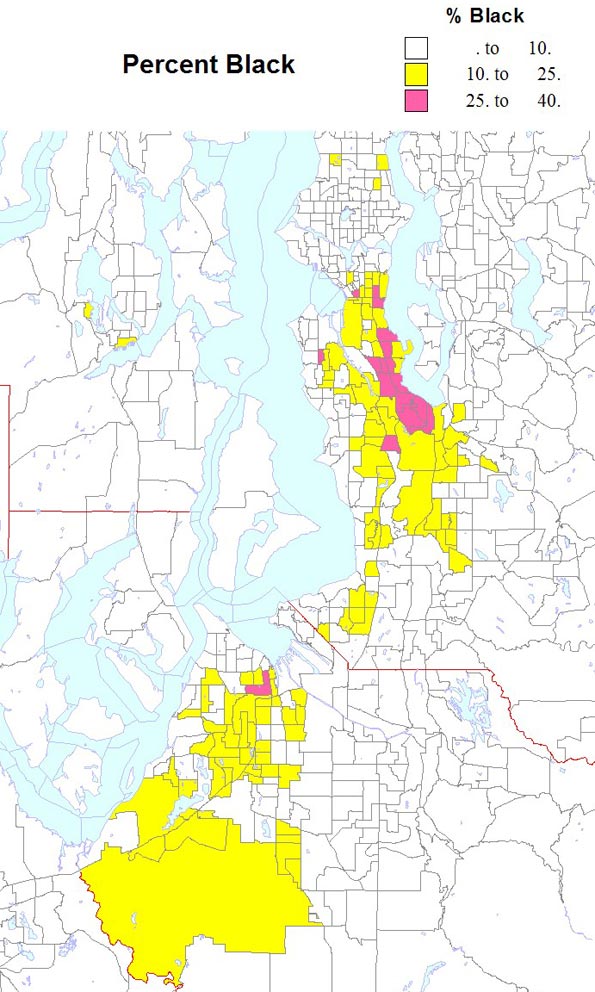
The Black share of the population, which did grow substantially in the decade, grew mainly in the very south end of Seattle, south to Tukwila, a smaller area in south Tacoma, with belts over 10 percent Black covering much of central and south Seattle, south King county and much of Tacoma and Lakewood. Unlike the 1960s through 1980s, there is NO tract over half Black (the highest is 41 percent). Shares in most of the region remain well below 5 percent, rural small town areas below one percent. Blacks and Asians are not well represented outside greater Seattle.
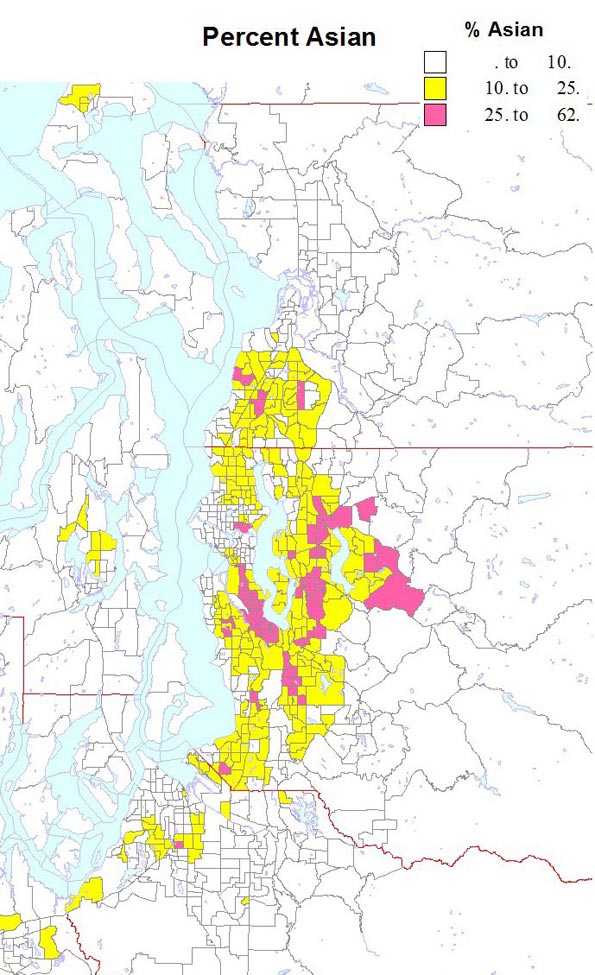
The Asian population is much larger than the Black total, and higher shares are far more widespread. Unlike the concentration that has long existed on south Seattle’s Beacon Hill , the 2010 map shows equally high shares in many parts of the eastside, especially Bellevue and Redmond and Sammamish, and smaller areas in south King county and south Everett. The newer areas are also areas of high foreign born and immigration of professionals from Asia.
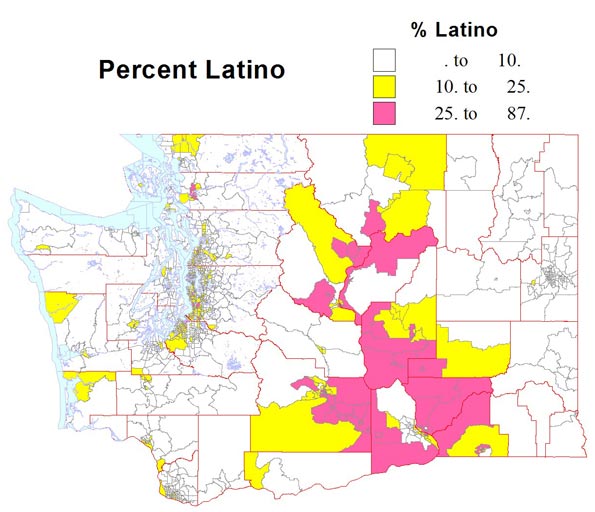
Unlike the Black and Asian populations, the Native American and Latino populations are more prevalent outside the metropolitan Seattle core. The Native American population resides mainly on official reservations, often dominating their census tracts. The largest area and population is associated with the Yakama nation in central Washington. The Latino population of the state increased 71 percent to 756,000 in 2010. From the map, it’s clear that the Latino population follows the irrigated agriculture of the Columbia basin, including the small metropolitan areas of the Tri Cities (Kennewick-Richland-Pasco) and Yakima.
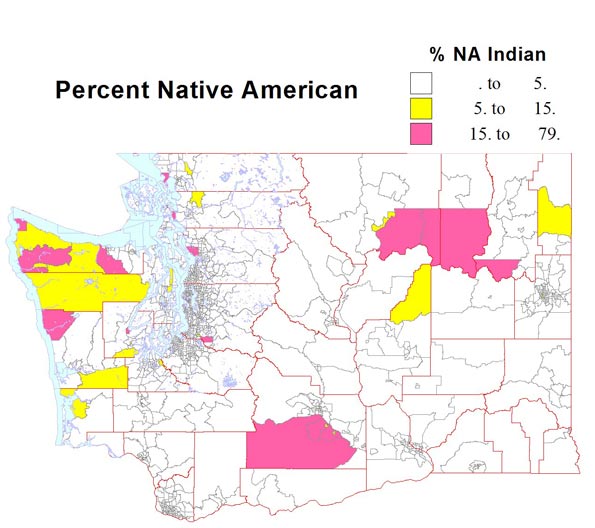
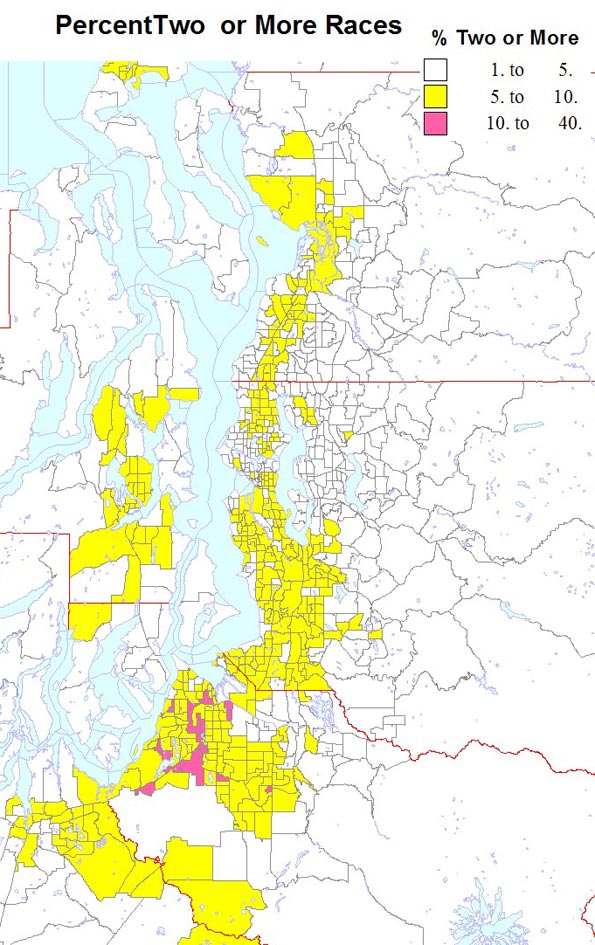
The highest Latino shares in the metropolis are in south King county and Pierce county, rather similar to the pattern for African-Americans, but with a more westerly orientation in south Seattle and Renton. Native American populations remain quite concentrated in the recognized reservations, quite urban in Tacoma (Puyallup), suburban in Snohomish and King counties, and exurban in Kitsap county. About five percent of Washingtonians identify as of two or more races, a remarkable 47 percent increase. The main areas are most associated with the major military reservation , Ft. Lewis-Mc Chord in Pierce county, with lesser shares in highly diverse south Seattle and south King county.
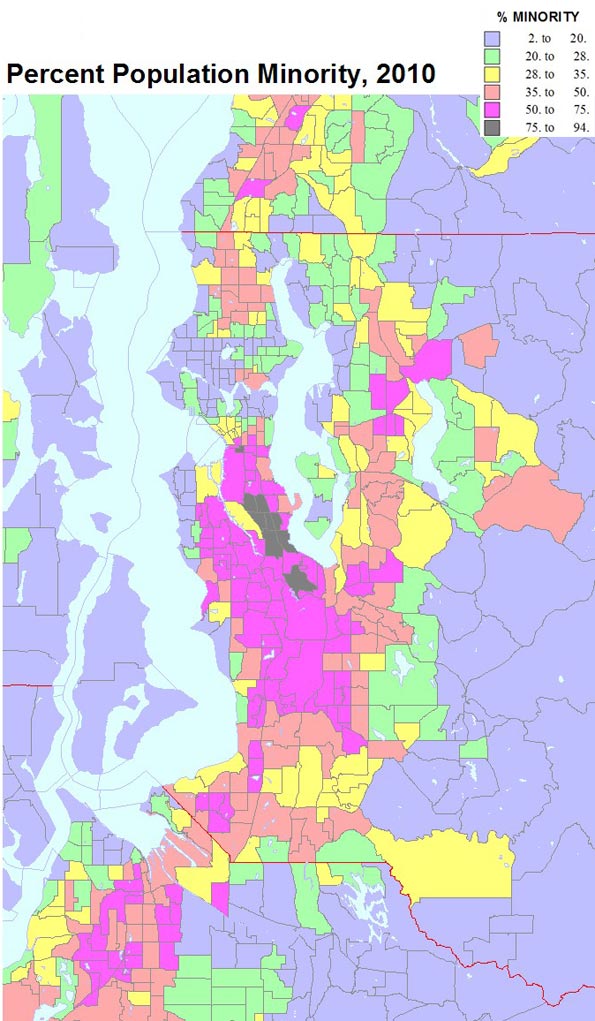
A map of all minorities would attest to the diversification of two parts of the state, the Columbia basin in eastern Washington, and the greater Seattle area, with up to half the urban footprint showing shares over 35 percent non-white, and with much of south King county and south Tacoma, and parts of Bellevue-Redmond now over 50 percent. This is a remarkable shift from an overwhelmingly white suburbia of 20 years earlier.
Perhaps even more revealing has been the low share of minorities in professional, affluent, highly educated parts of Seattle--- what analyst Aaron Renn has dubbed “the white city”. Homogeneity also prevailed in far suburban, exurban and rural areas but these areas rarely lay much claim to be “multicultural.”
The change in greater Seattle’s Black population reveals its continuing exodus/displacement from Seattle, and its continuing suburbanization. Asians too experienced tremendous growth in the suburbs, especially in eastern King county and suburban Snohomish county. Change in the Latino population, like that of the Black population, is greatest in south King county, into south Tacoma, but also in the SR99 corridor in Snohomish county. Growth in both the Black and Latino populations follows that of less affluent housing markets than is evident in the areas with expanding Asian populations.
The map of minority population change for the Seattle region highlights the exceptionalism of the city of Seattle. Most observers would probably be drawn to the dramatic and obvious diversification of suburbia, in all directions, north, east and south of Seattle. But as a 55 year resident of Seattle, the most dramatic feature is that much of Seattle has become whiter or only slightly more diverse. In contrast the bulk of the region has become more ethnically and racially complex .
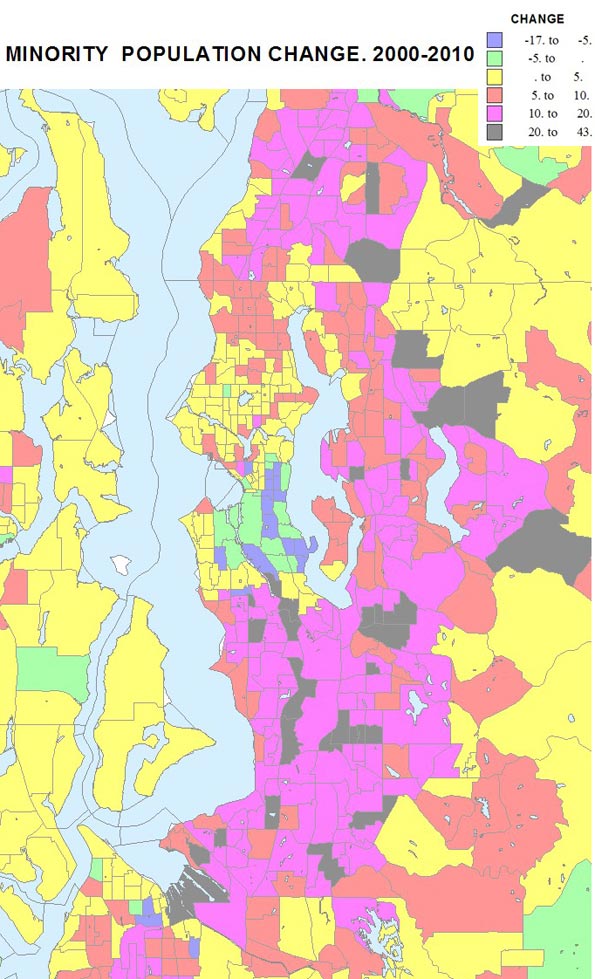
The reasons for this redistribution are complex, but we know that the popularity of living in Seattle on the part of younger, less familial and more professional households, together with shifts in the housing stock away from family housing, was critical in making the central city less diverse and the rest of the region, and much of the state, more so.
Diversity
How can we measure diversity?. Usually it is measured as the degree to which the shares of major racial and ethnic groups are equal. So maximum diversity for six groups (Blacks, Native Americans, Asians, Latinos, Whites, and those of two or more races, would be .167, if each group were one sixth. An area 100 percent of one race would have zero diversity or an index of 1.
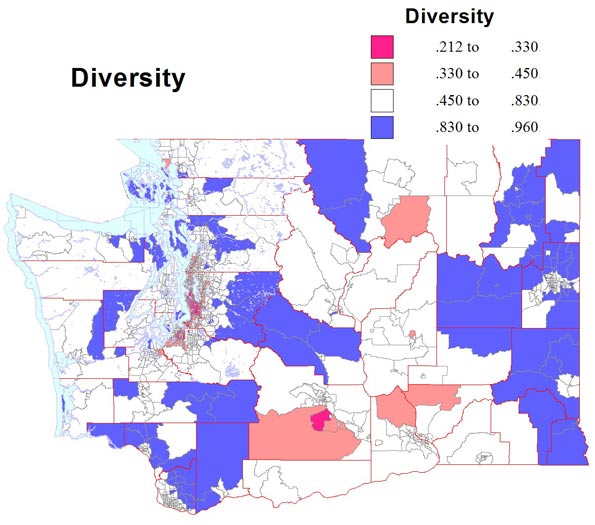
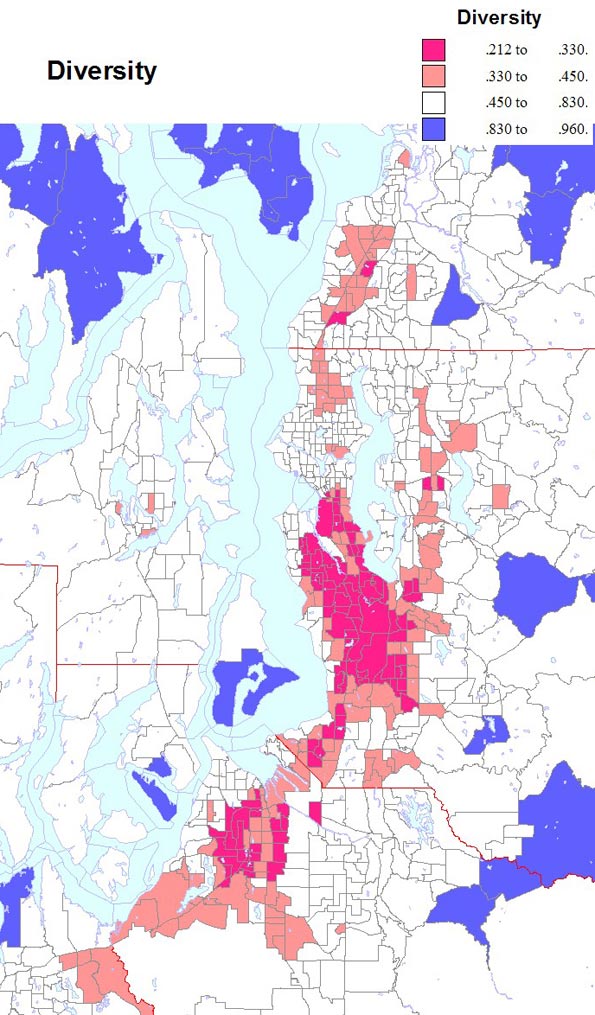
Viewed this way, the 2010 census may surprise the reader. Seattle has long been the most or among the few most diverse places in the state and many people probably believe it still is. But according to the 2010 census Seattle has been displaced by dozens of places in its own region! It has become slightly more diverse, as suburban cities, mainly but not only to the south have become markedly more diverse. Many might also think eastern Washington, with its increasing Latino population, must be highly diverse. But no, the hotbed of diversity is from the southern part of Seattle, through south King County, to and beyond Tacoma. Table 1 lists the most diverse places. The top six most diverse places are just beyond the city of Seattle, and their diversity is amazingly high. In Pierce County a belt of high diversity extends from Fife and the Puyallup reservation across south Tacoma to Lakewood, Parkland, Spanaway and Ft.Lewis-McChord. This is truly a remarkable transformation.
| Most Diverse Urban Places in Washington | ||
| Rank | Place | Diversity |
| 1 | Tukwila | 0.241 |
| 2 | Sea Tac | 0.247 |
| 3 | BrynMawr-Skyway | 0.249 |
| 4 | Boulevard Park | 0.259 |
| 5 | White Center | 0.264 |
| 6 | Riverton | 0.273 |
| 7 | Fife | 0.295 |
| 8 | Kent | 0.312 |
| 9 | Renton | 0.319 |
| 10 | Federal Way | 0.324 |
| 22 | Tacoma | 0.401 |
| 40 | Seattle | 0.471 |
Washington state and even greater Seattle are still much “whiter” than most other larger states. The exception has been a relatively high share of Asian people, due to our port of entry position from Asia. But the last decade has been one of increasing diversity, especially in metropolitan suburbs and in eastern Washington.
Richard Morrill is Professor Emeritus of Geography and Environmental Studies, University of Washington. His research interests include: political geography (voting behavior, redistricting, local governance), population/demography/settlement/migration, urban geography and planning, urban transportation (i.e., old fashioned generalist).


Wonderful illustrated
Wonderful illustrated information. I thank you about that. No doubt it will be very useful for my future projects. Would like to see some other posts on the same subject!
series online
This is really a nice and
This is really a nice and informative, containing all information and also has a great impact on the new technology. Thanks for sharing it,
can an average guy get a hot girlfriend
Your content is nothing
Your content is nothing short of brilliant in many ways. I think this is engaging and eye-opening material. Thank you so much for caring about your content and your readers.
https://www.rebelmouse.com/languageofdesirereviews/
I recently came across your
I recently came across your blog and have been reading along. I thought I would leave my first comment. I don’t know what to say except that I have enjoyed reading. Nice blog, I will keep visiting this blog very often.
rebelmouse
I am definitely enjoying
I am definitely enjoying your website. You definitely have some great insight and great stories.
https://rebelmouse.com/obsessionphrasesreviews/
thirsties all in one diaper
Washington state and even greater Seattle are still much “whiter” than most other larger states. The exception has been a relatively high share of Asian people, due to our port of entry position from Asia.
thirsties all in one diaper