
Race and ancestry, or countries/peoples of origin, are popular topics, with large amounts of data attempting to help us understand the ethnic nature of the country. In this paper I attempt a summary description of the intersections of race, ancestry, and genome, at the state level, but I hasten to emphasize that the “findings” are tentative, highly uncertain, and based on astoundingly unreliable data. I hope some readers may point the way to better data or safer interpretations.
Table 1 presents a summary of numbers of people by ”race” by broad ancestral/ethnic or countries of origin together with the main Y-DNA (male) genetic haplogroups associated with the racial and ancestral groups. The haplogroups are male individuals who share a particular mutation or common male ancestor up to 50,000 years ago. All this is uncertain and speculative, for these reasons. The race and ancestral identifications are self-reported, and subject to lying as well as ignorance. But we still can make beautiful detailed maps, down to the county level! The numbers of persons with good DNA analyses are too few to permit highly confident estimates at useful levels of geography. But let’s see what we have.
| Table 1 | Race, Ancestry, Haplogroups | ||||
| Group | Number (millions) | Ancestry group | Number (millions) | Haplogroups | |
| White |
215
|
||||
| White,nonihisp |
192
|
Eng,Scot,Ire |
87
|
R1b
|
I
|
| Germany-Scaand |
50
|
R1b
|
I
|
||
| SCAndin |
10
|
I
|
R1b
|
||
| France Belg |
12
|
R1b
|
|||
| Italy |
16
|
R1b
|
J
|
||
| E Europe |
16
|
R1a
|
I,J,N
|
||
| Balkans,Near east |
2
|
J, G
|
|||
| WhiteHispan |
23
|
Mexico |
16
|
R1b
|
|
| CentAmer,Carib |
7
|
R1b
|
|||
| African |
40
|
E
|
|||
| Asian |
14
|
Mod white admix |
O
|
||
| NatAmerican |
34
|
US, AK |
5
|
Q
|
R1b
|
| LatAmericca |
29
|
||||
| Pacific Islan |
0.4
|
Hi white admix |
up to 50%
|
||
| Mixed compl |
9
|
M
|
|||
Race
Well, some 215 million people are probably mainly white (69%), of which 192 million (61%) are self-identified non-Hispanic white. The difference of 23 million are people who identify as white and Hispanic. About 40 million identify as Black or African-American, although there is probably an admixture of 20 percent or more of “whiteness”. Up to 14 million identify as of Asian origin, but as many as 1 million may be white in genetics and appearance, e.g. people from Afghanistan, NW India or West Pakistan. Finally less than 1 million identify as Pacific Islanders.
This leaves a large number of 34 million who identify as all or partly Native American, including about 5 million Alaskan or US Native American, about half of whom are clearly Native American, but about half of whom appear to be and are probably genetically mostly white. Then 29 million are “Mexican” or Caribbean, etc., not a race, but a perceived or actual combination of Spanish (some Portuguese) and Native Americans, from the US southwest, central America, the Caribbean, and South America. Even though these people legitimately identify as a mix of Native and Spanish, most are genetically “white” (see below).
Ancestry, country of origin, or ethnicity are even harder categories. The complexity is incredible. Not only have the “countries” changed again and again over the last few centuries, but persons’ stated identities, which can be multiple, are often bewildering, because of centuries of mixing, often with people who may not know their heritage. For example, some 20 million identify as “American” which is perfectly reasonable, if they are descended from early immigrants (1620 to 1820). People also do reasonably identify with more than one county/people, but these combinations are not tabulated, and it is difficult to claim accuracy from the data on ancestry. Finally, most of our ancestries are European countries, but we know from both history and genetic analysis that people have mingled and moved within “Europe” for thousands of years.
Given these warnings, what do we almost know? The largest groupings of non-Hispanic whites first the English-Scottish-Irish at some 87 million, 28% of the population, followed by Germans (including Dutch, Austrian, Swiss) at about 50 million, and Scandinavians at 10 million. Others from Western Europe include 16 million from Italy and probably 12 million from France. Eastern Europe is the origin of about 16 million, including 9 million from Poland, 3.5 million from Russia, and 1.5 million from both Hungary and Czechoslovakia, and over 1 million from Greece. About 2 million are from the eastern Balkans and the Middle East.
As discussed above, self-identified Hispanic whites number some 23 million, people with an African origin perhaps 40 million, of an Asian origin, 13 million, then up to 34 million as from Native American or Native-American-Spanish admixture.
Genetic composition
Much has been learned about the genetic evolution of humans and of their complex migration out of Africa, then across the globe. Since the majority of Americans are of European ancestry, the genome story of Europe translates to the genetic structure of the United States. Table 2 summarizes the numbers of persons by haplogroup estimated for the US population. In Table 1 I added an estimate of the haplogroups associated with the racial-ancestral combinations. These are tentative and will be worked on further.
| Table 2 | Major haplogroups | ||
| Group | Population | % of population | Areas |
| R1b |
156
|
50
|
W Europe |
| E |
43
|
14
|
Africa |
| I |
44
|
13
|
Mid Europe |
| R1a |
16
|
6
|
E Europe |
| J |
14
|
5
|
SE Europe, Near East |
| G |
12
|
4
|
SW Asia |
| O |
10
|
3
|
Asia |
| Q |
9
|
3
|
NatAmerican |
| N |
2
|
0.7
|
Baltic, Siberia |
| M |
0.5
|
0.2
|
Pacific Island |
The relevant haplogroups are:
- E, over 50,000 years old, still dominant in Africa, and the many descendant groups of equally old
- F, which developed in south Asia (India-Pakistan), from the earliest migration out of Africa (Europe was still ice-bound). All F subgroups seem to have differentiated in the same hearth area (India to the Caucasus), gradually moving northwest.
- G occurs in modest numbers in Italy, Turkey and the Balkans,
- N in the Baltic countries and Siberia,
- I divided into I1, still strongly Scandinavian and I2 in south Italy and the west Balkans
- J in Greece and the Middle East (includes most Jews).
- R1b swept into Europe, dominant from Italy through France, Spain, Portugal, Belgium on through England and Ireland (plus North Africa).
- R1a is strongest in Eastern Europe (Poland, Czechoslovakia, and Russia)
- O, Asian
- Q, Native American
Evidently groups G, I and J were in Europe by 25,000 years ago, N 20,000 years ago, but the now dominant groups R (R1a, R1b) not until 15 to 20,000 years ago.
| Sequencing of haplogroups | |||||||||
| Yrs BP | |||||||||
|
50-52,000
|
E | F | |||||||
|
45,000
|
G | HIJK | |||||||
|
40,000
|
IJ | K | |||||||
|
30,000
|
I | J | K2 | ||||||
|
25,000
|
E | G | I1,I2 | J | NO | K2 | |||
|
20,000
|
N | O | P | ||||||
|
17,000
|
E | G | I1,I2 | j | N | O | M | Q | R |
| R1a,R1b | |||||||||
In the tables and maps I distinguish between the R1B peoples dominantly English, German or French-Italian, and an R1bh population, which is the self-reported American Hispanic population, but which is not genetically different, from the male Y-dana point of view.
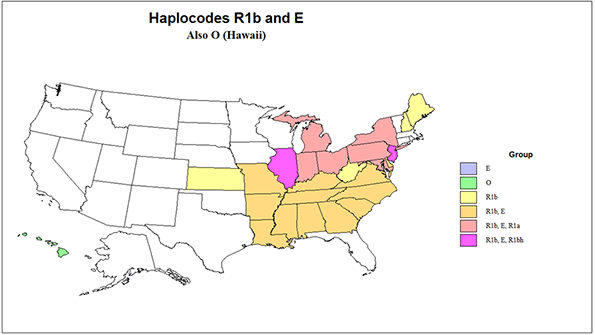
How does this translate to US states (besides with difficulty)? The estimates are based on the self-reported ancestry of people by states and related to the haplogroups of those ancestries. Please see Table 3 and three maps of states the classification is based on the top 2 or 3 relevant haplogroups. HI is unique as the only state with a dominant O, Asian, group, and the District of Columbia as the only area dominated by E (African origin).
Four states, KS, ME, NH, and WV are most strongly just R1b (West European – English, German and Italian-French). The largest number of states, 12, the historic south, plus MO, are primarily R1b and secondarily E. Six states are also strong in R1b and E, but also in R1a, eastern Europe, IN, MD,MI, OH, NY (also has Hispanic and Jewish), and PA. Somewhat similar are IL and NJ (notice that many of these are contiguous), with R1b, E, and R1bh.
| Estimated Haplogroups for US states | |||||||||
| State | Dominant group | Share | 2nd (share) | 3rd (share) | 4th (share) | Rb1Eng | Rb1erm | Rb1FRIT | |
| AL | R1b | 50 | E 25 | 38 | 8 | 4 | |||
| AK | R1b | 56 | Q 13 | I 7 | R1a 6 | 28 | 21 | 7 | |
| AZ | R1b | 53 | R1bh 25 | E 7 | R1a 6 | 28 | 17 | 8 | |
| AR | R1b | 70 | E 13 | 38 | 28 | 4 | |||
| CA | R1b | 37 | R1bh 30 | O 14 | E 7 | R1a5 | 19 | 11 | 7 |
| CO | R1b | 68 | R1bh 16 | R1a 6 | I 6 | 33 | 25 | 10 | |
| CT | R1b | 76 | R1a 15 | 34 | 13 | 29 | |||
| DE | R1b | 69 | E 14 | 38 | 18 | 13 | |||
| DC | E | 43 | R1b 31 | 17 | 8 | 6 | |||
| FL | R1b | 52 | R1bh 20 | E 15 | R1a8 | J 5 | 30 | 12 | 10 |
| GA | R1b | 50 | E 30 | 37 | 9 | 4 | |||
| HI | O 40 | R1b 22 | M 16 | 13 | 1 | 8 | |||
| ID | R1b | 70 | I 8 | 41 | 22 | 7 | |||
| IL | R1b | 56 | E 15 | R1bh 12 | R1a 6 | 27 | 22 | 9 | |
| IN | R1b | 69 | E 7 | R1a 6 | 37 | 27 | 5 | ||
| IA | R1b | 81 | I>10 | 33 | 43 | 5 | |||
| KS | R1b | 70 | 35 | 32 | 3 | ||||
| KY | R1b | 71 | E 7 | 50 | 17 | 4 | |||
| LA | R1b | 55 | E 25 | 24 | 9 | 22 | |||
| ME | R1b | 97 | 56 | 10 | 31 | ||||
| MD | R1b | 53 | E 24 | R1a 8 | 29 | 16 | 8 | ||
| MA | R1b | 80 | R1a 8 | 42 | 8 | 30 | |||
| MI | R1b | 69 | E 14 | R1a 11 | J 5 | 30 | 27 | 12 | |
| MN | R1b | 68 | I 16 + | R1a 8 | 23 | 38 | 7 | ||
| MS | R1b | 44 | E 28 | 32 | 7 | 5 | |||
| MO | R1b | 74 | E 12 | 38 | 29 | 7 | |||
| MT | R1b | 78 | I 11 | Q 7 | 40 | 30 | 8 | ||
| NE | R1b | 79 | R1a 11 | I 9 | 32 | 41 | 6 | ||
| NV | R1b | 51 | R1bh 20 | 27 | 14 | 10 | |||
| NH | R1b | 96 | 50 | 10 | 37 | ||||
| NJ | R1b | 58 | E 17 | R1bh 13 | R1a >12 | J 8 | 26 | 13 | 19 |
| NM | R1b | 55 | R1bh 35 | Q >10 | 33 | 17 | 5 | ||
| NY | R1b | 56 | E 15 | R1a 10 | R1bh 9 | J 7 | 26 | 13 | 17 |
| NC | R1b | 55 | E 20 | 36 | 12 | 7 | |||
| ND | R1b | 72 | I>10 | R1a 9 | 19 | 46 | 7 | ||
| OH | R1b | 66 | E 12 | R1a >10 | 28 | 29 | 9 | ||
| OK | R1b | 55 | Q 10 | E 7 | 34 | 17 | 4 | ||
| OR | R1b | 67 | I 9 | 36 | 23 | 8 | |||
| PA | R1b | 77 | R1a 11 | E 10 | 34 | 29 | 14 | ||
| RI | R1b | 89 | R1a 7 | 38 | 6 | 45 | |||
| SC | R1b | 53 | E 28 | 37 | 11 | 5 | |||
| SD | R1b | 70 | I 20? | Q 9 | R1a6 | 25 | 40 | 5 | |
| TN | R1b | 59 | E 17 | 43 | 12 | 4 | |||
| TX | R1b | 49 | R1bh 30 | E 13 | 22 | 12 | 15 | ||
| UT | R1b | 65 | I 13 | R1bh 12 | 44 | 15 | 6 | ||
| VT | R1b | 93 | R1a 5 | 50 | 12 | 31 | |||
| VA | R1b | 56 | E 20 | 37 | 13 | 6 | |||
| WA | R1b | 63 | I >10 | O 7 | R1bh 6 | 33 | 22 | 8 | |
| WV | R1b | 73 | 45 | 21 | 7 | ||||
| WV | R1b | 77 | I >10 | R1a >10 | 24 | 45 | 8 | ||
| WY | R1b | 80 | Q 5 | I >5 | 43 | 29 | 8 | ||
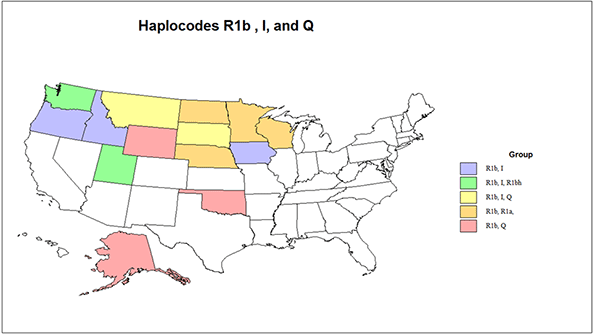
The second map includes a set with the R1b and I1 combination (high in Scandinavian also), ID, IA, and OR, a related pair with a significant R1bh presence, UT and WA, which also has a sizeable O population. Also related are MT and SD, with R1b, I but also Q (Native American). States with R1b, I and also R1a (Eastern Europe) include MN, NE, ND and WI. Three states have R1b, then Q or Q and I: OK<WY and AK (the highest Q share at 13%).
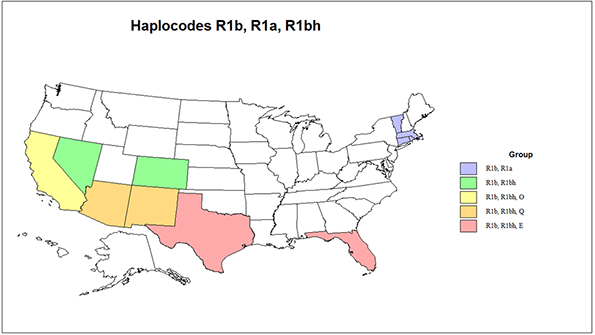
The third map shows first four states with R1b and R1a, all in New England: CT, MA, RI and VT. CO and NV have the combination of R1b and R1bh. CA is quite complex, with only a modest R1b share, a very large r1bh share, and also a sizeable O and then E share. AZ and NM also have R1b, R1bh, but also Q (Native American). FL is also complex, with R1b, R1bh, but also E, R1a and J.
Ancestry
I also present a few maps of ancestry combinations (most published maps show the single strongest). The shares of English (plus Scot and Irish), German (plus Austria, Netherlands and Switzerland) and French-Italian (plus Belgium) – all part of the R1b group, are also shown in Table 3.
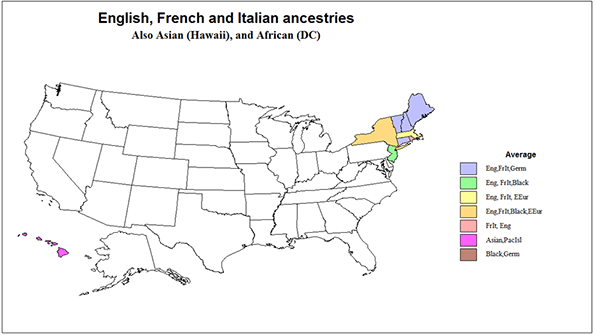
English and German (19 states) and German and English (7) are the most common ancestries of Americans (Map 4). English and German by themselves dominate most in KS and WV. Scandinavian is added to English-German for ID, OR and WA (which also adds Asian), and to German-English, for IA, MN, ND, SD, then together with East European for NE and WI. These 11 states are the most “northern European”. Native Americans are added most for MT, OK, WY and especially AK (now 15 states) and then a Hispanic component to CO and UT.
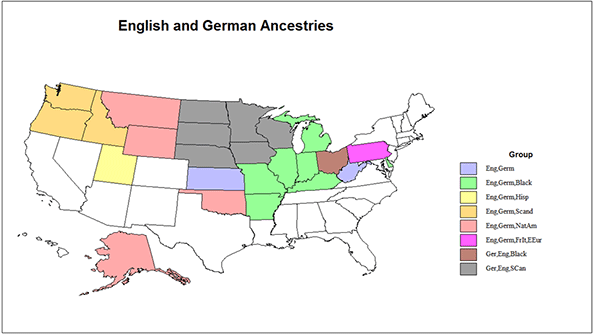
The English-German and German-English sets include 8 more states with a sizeable Black population, AR, DE, IL, IN, KY, MI and MO, and OH, then PA with a sizeable French-Italian and East European population as well. The full set is also a contiguous bloc across much of the north, and crossing into the south central.
Not surprising (Map 5) is the English Hispanic (AZ, NV) and Hispanic-English, (NM, plus CA and TX, with additional Asian and German, and Black and French-Italian, respectively), covering the southwest, plus FL, adding a Black population). An English-Black combination coves the rest of the southern portion of the country - LA (Black English, French), then AL. GA, MS, NC, SC, TN and even MD.
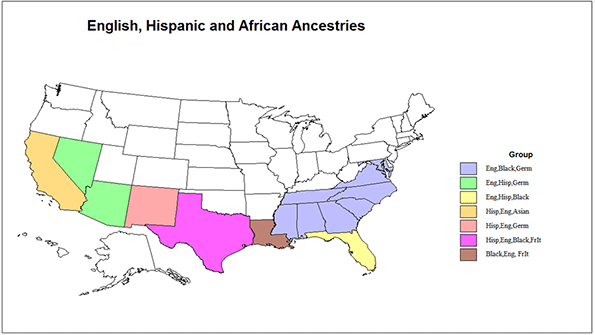
This leaves, (Map 6) besides HI and DC, a northeastern set of 8 states with a distinctive combination of English and French-Italian, CT, ME, NH, RI, VT, plus MA, adding E European) and complex NY, adding Black and East European. The entire mosaic reveals the fascinating stories of immigration and subsequent migration, still ongoing and becoming ever more complex.
Richard Morrill is Professor Emeritus of Geography and Environmental Studies, University of Washington. His research interests include: political geography (voting behavior, redistricting, local governance), population/demography/settlement/migration, urban geography and planning, urban transportation (i.e., old fashioned generalist).


