
"Soaring" land and house prices "certainly represent the biggest single failure" of smart growth, which has contributed to an increase in prices that is unprecedented in history. This finding could well have been from our new The Housing Crash and Smart Growth, but this observation was made by one of the world's leading urbanologists, Sir Peter Hall, in a classic work 40 years ago. Hall led an evaluation of the effects of the British Town and Country Planning Act of 1947 (The Containment of Urban England) between 1966 and 1971. The principal purpose of the Act had been urban containment, using the land rationing strategies of today's smart growth, such as urban growth boundaries and comprehensive plans that forbid development on large swaths of land that would otherwise be developable.
The Economics of Urban Containment (Smart Growth): The findings of Hall and his colleagues were echoed later by a Labour Government report in the mid-2000s which showed housing affordability had suffered under this planning regime. Author Kate Barker was a member of the Monetary Policy Committee of the Bank of England, which like America's Federal Reserve Board, is in charge of monetary policy. Among other things, the Barker Reports on housing and land use found that urban containment had driven the price of land with "planning permission" to many multiples (per acre) above that of comparable land where planning was prohibited. Under normal circumstances comparable land would have similar value.
Whether coming from the left or right, economists have demonstrated that prices tend to rise when supply is restricted, all things being equal. Certainly there can be no other reason for the price differentials virtually across the street that occur in smart growth areas. Dr. Arthur Grimes, Chairman of the Board of New Zealand's central bank (the Reserve Bank of New Zealand), found the differential on either side of Auckland's urban growth boundary at 10 times, while we found an 11 times difference in Portland across the urban growth boundary.
House Prices in America: The Historical Norm: Since World War II, median house prices in US metropolitan areas have generally been between 2.0 and 3.0 times median household incomes (a measure called the Median Multiple). This included California until 1970 (Figure 1). After that, housing became unaffordable in California, averaging nearly 1.5 times that of the rest of the nation during the 1980s and 1990s (adjusted for incomes). Even after the huge price declines from the peak of the bubble, house prices remain artificially high in Los Angeles, San Francisco, San Diego and San Jose, with median multiples of six or higher.
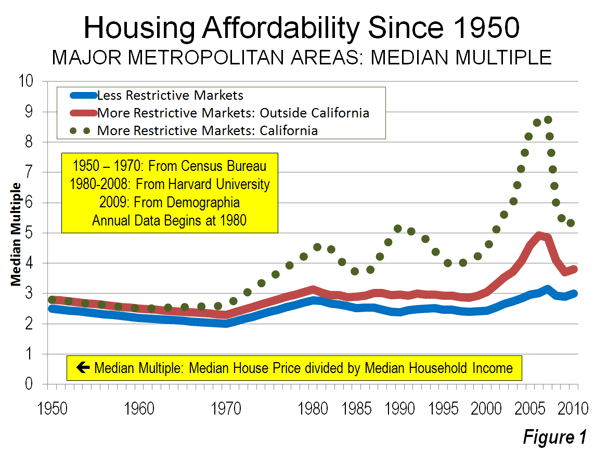
William Fischel of Dartmouth University examined a variety of justifications for the disproportionate rise of California housing prices and dismissed all but more restrictive land use regulation. He noted that "growth controls (restrictive land use regulations) have the undesirable effect of raising housing prices." Throughout the rest of the nation, more restrictive land use regulations have been present in every market where house prices rose substantially above the historic Median Multiple norm, even during the housing bubble. No market without smart growth has ever reached these heights.
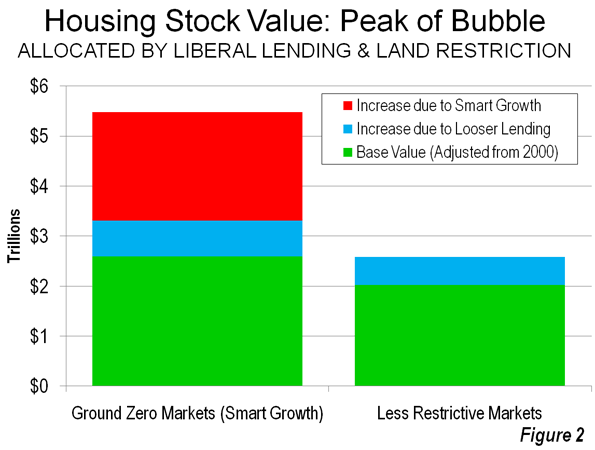
Setting Up for the Fall: Excessive Cost Increases in Smart Growth Markets: The Housing Crash and Smart Growth, published by the National Center for Policy Analysis, examined the causes of house price increase during the housing bubble. The analysis included all metropolitan areas with more than 1,000,000 population. It focused on 11 metropolitan areas in which the greatest cost increases occurred (the "ground zero" markets), comparing them to cost increases in the 22 metropolitan areas with less restrictive land use regulation (Note 1).
- Less Restrictively Regulated Markets: In the less restrictively regulated markets, the value of the housing stock rose approximately $560 billion, or 28 percent from 2000 to the peak of the bubble (Note 2). In nearly all of these markets, the Median Multiple remained within the historical range of 2.0 to 3.0 and none approached the high Median Multiples that occurred in the "ground zero" markets.
- Ground Zero Markets The value of the housing stock rose $2.9 trillion from 2000 to the peak of the bubble in the "ground zero" markets, all of which have significant land use restrictions (Note 3). The 112 percent increase in the "ground zero" markets was four times that of the less restrictively regulated markets. The Median Multiple rose to unprecedented levels in each of the "ground zero" markets, peaking at from 5.0 to more than 11.0, four times the historic norm.
The 28 percent increase in relative house value that occurred in the less restrictively regulated markets (those without smart growth) is attributed to the influence of loosened lending standards. The excess above 28 percent, which amounts to $2.2 in the "ground zero" markets is attributed to to the supply restricting strategies of smart growth (Figure 2).
The Fall: Smart Growth Losses
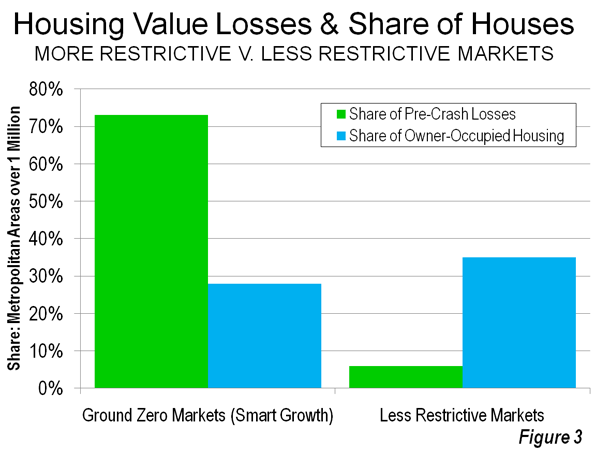
The largest house price drops occurred in the markets that had experienced the greatest cost escalation, both because prices were artificially higher but also because prices in smart growth markets are more volatile. The "ground zero" markets, with only 28 percent of the owner occupied housing stock, accounted for 73 percent of the pre-crash losses ($1.8 trillion). Thus, much of the cause of the housing crash, which most analysts date from the Lehman Brothers bankruptcy (September 15, 2008), can be attributed to these 11 metropolitan areas.
By contrast, the 22 less restrictively regulated markets accounted for only six percent ($0.16 trillion) of the pre-crash losses. These 22 markets represented 35 percent of the owned housing stock (Figure 3).
If the losses in the ground zero markets had been limited to the rate in the less restrictively regulated markets (the estimated impact of cheap credit), losses would have been $1.6 trillion less (Note 4). The Great Recession might not have been so "Great."
Economic Denial and Acknowledgement: In his writing forty years ago, Dr. Hall noted that English planners denied the connection between the unprecedented house price increases and urban containment. This same denial also informs smart growth advocates today. This is perhaps to be expected, because, as Hall noted 40 years ago, an understanding of the longer term consequences would have undermined support for these policies.
To their credit, some advocates recognize that smart growth raises house prices. The Costs of Sprawl – 2000¸ a volume largely sympathetic to smart growth, also indicates that urban containment strategies can raise housing prices. The only question is how much smart growth raises house prices. The presence of urban containment policy is the distinguishing characteristic of metropolitan markets where prices have escalated well beyond the historic norm.
The Social Costs of Smart Growth: Moreover, the social impacts of smart growth are by no means equitable. Peter Hall says that the "less affluent house-owner ... has paid the greatest price for (urban) containment" (Note 5). He continues: "there can be little doubt about the identity of the group that has got the poorest bargain. It is the really depressed class in the housing market: the poorer members of the privately-rented housing sector." Finally, Hall laments as well the impact of these policies on the "ideal of a property owning democracy."
Hall's four decades old concern strikes a chord on this side of the Atlantic. Just last week, a New York Times/CBS News poll found that nine out of ten respondents associated home property ownership with the American Dream. Planning needs to facilitate people's preferences, not get in their way.
--------
Note 1: The housing stock value uses a 2000 base, which adjusts house prices based upon the change in household incomes to the peak.
Note 2: The underlying demand for housing was substantial in some of the less restrictively markets, which is illustrated by the strong net domestic migration to metropolitan areas such as Atlanta, Austin, Dallas – Fort Worth, Houston, Raleigh and San Antonio. At the same time, some more restrictive markets (smart growth) that hit historically experienced strong demand were experiencing huge domestic outmigration, indicating little in underlying demand. This includes Los Angeles, San Francisco, San Diego and San Jose. Demand, however is driven upward in more restrictively metropolitan areas by speculation which, according to the Federal Reserve Bank of Dallas is attracted by supply constraints.
Note 3: The 11 "ground zero" metropolitan markets were Los Angeles, San Francisco, San Diego, San Jose, Sacramento, Riverside-San Bernardino, Las Vegas, Phoenix, Tampa-St. Petersburg, Miami and the Washington, DC area.
Note 4: The pre-crash losses in the 18 other restrictively regulated markets were $0.5 trillion. These markets accounted for 37 percent of owner occupied housing in the metropolitan areas of more than 1,000,000 population, compared to 35 percent in the less restrictively regulated markets, yet had losses three times as high.
Note 5: The Containment of Urban England also indicates that new house sizes have been forced downward by the planning regulations (see photo at the top of the article).
Photograph: New, smaller exurban housing in the London area (by author)
Wendell Cox is a Visiting Professor, Conservatoire National des Arts et Metiers, Paris and the author of “War on the Dream: How Anti-Sprawl Policy Threatens the Quality of Life”


