
2010 was the 100th anniversary of the start of the “Great Migration” of the “Negro” population to northern cities from the mainly rural South. The midway point occurred in 1960 when black urban population was beginning to peak.
Since then redistribution had taken several forms. First, we see some return migration to the South, but to metropolitan, but not to the rural small town “Black Belt” of the past but to the sprawling metropolitan regions. Second, there is a decline of black population in metropolitan core cities and counties because of suburbanization. Third, we see a more dispersed growth of the Black population to a wider set of large metropolitan areas across the country.
In this essay I map and discuss first state level change in the Black population for 1910, 1960 and 2010, then concentrate on US counties which were majority Black in 1910, 1960 or 2010 or housed over 100,000 Black population in 2010, whatever the share. Special note is made of counties which were majority in combinations of the three times, 1910, 1960 and 2010.
For states I map and discuss change for two critical 50 year periods, 1910 through 1960 and 1960 through 2010. The first encloses both the Great Migration from World War One and the equally large migration from south to north and west in World War II still firmly within the unreconstructed Jim Crow segregation era. The past 50 years coincides with the rise of the South economically and demographically. Changes wrought by the Civil Rights Revolution brought the at least formal achievement of greater equality—culminated symbolically by the election of a Black President.
In 1910 the South had 8.75 million of nation’s 9.83 million “Negroes”, an 89 percent share. By 1960 the southern share had fallen to under 60% with 11.31 of 18.97 million Black population. By 2010 the South had 22 of 39 million Blacks, for 56 percent, still a sizeable majority.
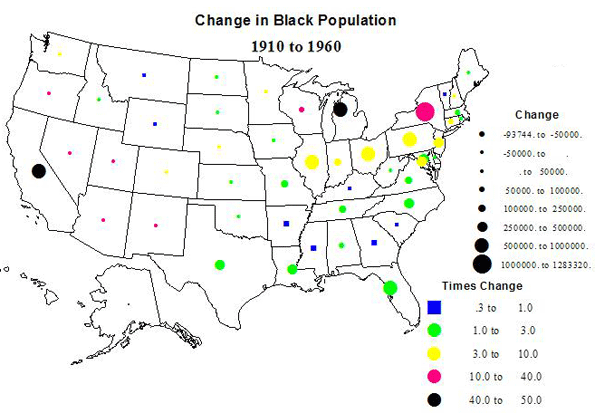
For 1910 to 1960 absolute and relative changes are depicted in Figure 1. In absolute numbers New York gained the most, 1.3 million, but California and especially Michigan had the highest rates of growth, with 40 times their 1910 population in 1960. The largest absolute gains, after New York, were in Illinois (Chicago), California, Michigan, Ohio and Pennsylvania. Note that the highest growth was in industrial belt states. In the South, Texas, Louisiana, North Carolina and Virginia – growing and industrializing – experience growth but at modest rates as Black people moved to the growing cities. The Deep South states, with the highest Black shares in 1910, Arkansas, Mississippi, South Carolina, Georgia and even Kentucky experienced absolute losses of Black people over the 50 years.
For 1960 to 2010, changes are depicted in Figure 2, The highest rates of growth were in states historically very low in Black shares, as Minnesota, Utah, Arizona, New Hampshire and Vermont, with fairly large numbers for Minnesota, Arizona, the Dakotas and Nevada. Remarkably high rates and amounts of growth ocurred in Florida and Maryland (suburbanization from Washington, DC) and substantial growth occurred in the metropolitan dynamos of the South, Georgia (Atlanta) and Texas (especially Houston).
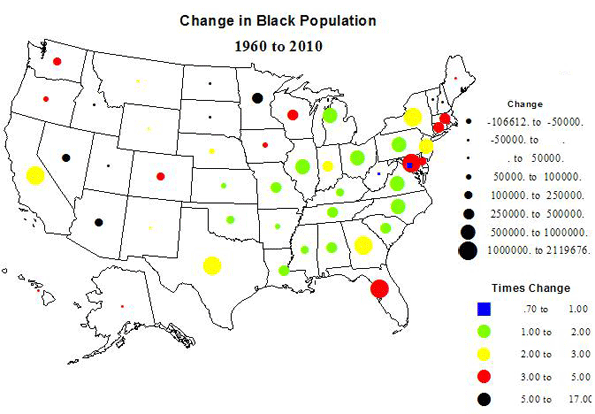
Growth slowed in mostof the northern industrial belt. Only West Virginia experienced a decline in the Black population (Washington DC lost via gentrification and Black suburbanization). The percent Black fell in AL, AR, DC, MS, NC, SC, VA and WV, most of the South, and even in FL and TX, despite large absolute gains. The highest increase in the Black population (number of times higher) were in mainly white NV, MN, VT and ND.
Over the full century, among the 27 states with the largest total Black population, the highest rates of change were for Wisconsin, California, Michigan, Connecticut and New York, and the highest absolute growth were in New York, Florida, Texas and California. The lowest rate was for Arkansas, barely above the 1910 level, followed by Kentucky and Mississippi.
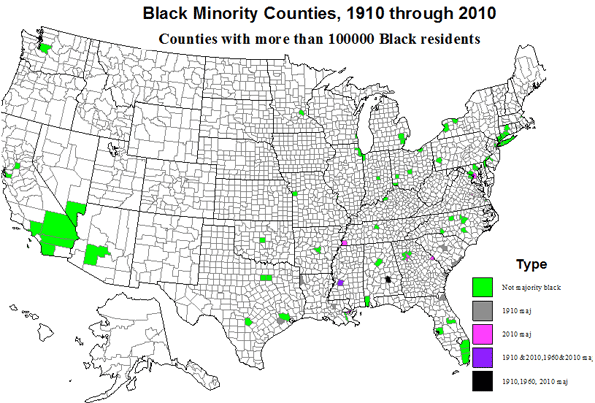
I do offer two maps at the county level for Black population change 1960 to 2010, but only for a select set of 359 counties, those with a majority Black in 1910, 1960 or 2010, or with at least 100,000 Black persons in 2010.
As can be seen from the map, all counties (288) with a majority Black at one or more of the three times (1910, 1960 or 2010) are located in the South, including 18 which also had over 100,000 Black persons in 2010 Of the 71 counties that were never a majority Black but had over 100,000 Black population in 2010, 30 more are in the South. Those outside the South (42) are basically the rest of the country’s largest metropolitan counties.
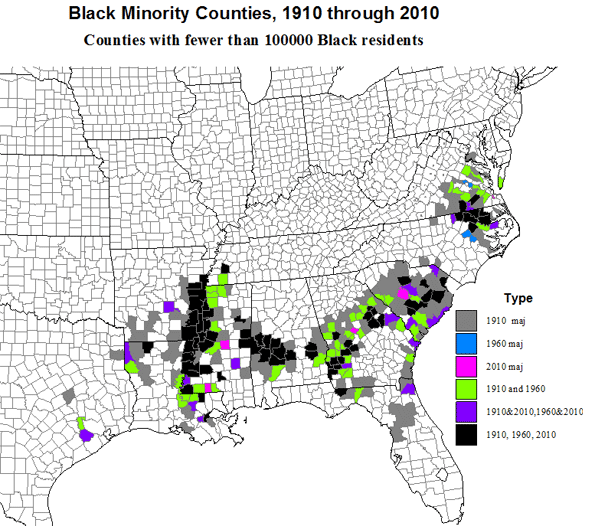
The majority Black counties define the traditional “Black Belt” of slavery and plantation agriculture across the US South from east Texas to Maryland. The micro-geography of Black majority counties is amazingly unchanged. The dominant areas: the Mississippi Delta and the states Alabama, Georgia, South Carolina, North Carolina and Virginia show cores of 177 counties that have had a Black majority in all three censuses, surrounded by a set of 66 with a Black majority in two of the three census counts, and at the fringe the 128 counties which had a Black majority only in 1910.
The only area with over 100,000 Black persons and with a Black majority in 1960 and 2010 was Washington, DC, the only one in 1910 and 2010 was Hinds county (Jackson, Mississippi), and the only in all three censuses was Montgomery, Alabama, all government-centered cities in the South,
But although the South is still dominant, most of the largest absolute totals are outside the South. New York City alone has over 2 million Black persons, Cook county (Chicago) 1.3 million, Los Angeles, 857,000. Southern metropolises are increasingly important. Harris County Texas (Houston), for example, has more African-Americans (775,000) than Detroit or Philadelphia. Suburban Prince George, MD, 557,000, Dallas, 528,000 and Miami-Dade, 473,000 and Fulton (Atlanta, 466,000, plus 376,000 in De Kalb) all contain large black populations. Only in the South are there high Black populations in rural, small town to small city counties typically in the traditional areas. In the North, Black persons are highly concentrated in the largest core metropolitan counties. Metropolitan Black populations have grown greatly in the South as well, including more suburbanization than in the North.
Conclusion
The overall story of the American Black population is one of great change and of continuity—a dramatic spread from the rural South to the large metropolitan North, followed more recently by a partial return to the South’s expanding metropolitan areas. It also reflects growing suburbanization in both the North and the South, and a moderate spread to metropolitan areas in less traditionally Black parts of the country.
Richard Morrill is Professor Emeritus of Geography and Environmental Studies, University of Washington. His research interests include: political geography (voting behavior, redistricting, local governance), population/demography/settlement/migration, urban geography and planning, urban transportation (i.e., old fashioned generalist).


this information is useful
this information is useful, about me: son spec, son mykolor, son kova, son dulux, sơn jotun , son dong a, dịch vụ sơn nhà
It's Prince George's County, Maryland
Prince George County is in Virginia near Petersburg.
It's Prince George's County, Maryland
Prince George County is in Virginia near Petersburg.