
The latest figures from the United States Department of Transportation indicate that driving volumes remain depressed. In the 12 months ended in September 2011, driving was 1.1 percent below the same period five years ago. Since 2006, the year that employment peaked, driving has remained fairly steady, rising in two years (the peak was 2007) and falling in three years. At the same time, the population has grown by approximately four percent. As a result, the driving per household has fallen by approximately five percent.
There are likely a number of reasons for the driving decline, some of which are described below.
Democratization of Mobility: The leveling off of driving is something analysts have expected for some time. More than ten years ago, Alan Pisarski noted that drivers licenses and automobility had saturated the market among the While-non-Hispanic population. For decades, driving had been increasing at a substantially faster rate than the population, as driving rates for women and minorities converged upon the rate of White-non-Hispanic males.
Clearly, the continued, extraordinary increase in driving of recent decades could not be expected to continue, since nearly all were already driving. Pisarski called this the "democratization of mobility" in a 1999 paper. At that time only African-Americans and Hispanics were still behind the curve. The recent economic difficulties have slowed the progress toward equal automobility for minorities. In 2009, American Community Survey data indicates that the share of Hispanic households without access to a car remained 40 percent above White-non-Hispanic Whites. The rate of African-American no-car households was 20 percent above that of White-non-Hispanics. The driving decline reflects in large part the failure of the economy to produce equal mobility opportunities for minority households.
Higher Gasoline Prices and the Middle Class Squeeze: One of the most important factors has to be the unprecedented increase in gasoline prices. Over the past decade, gasoline prices have doubled (adjusted for inflation) and have remained persistently high. It has worsened in the last five years, with prices having risen more rapidly than in any period relative to the previous decade in the 80 years for which there are records. This has taken a huge toll on households. At average driving rates, budgets have increased by nearly $1,800 annually to pay for the higher gasoline prices. In a time (2000-2010) that median household incomes declined $3,700 (inflation adjusted), it is not surprising that people are driving less.
Unemployment: Not Driving to Work: Today's higher unemployment means that fewer people are driving to work. Employment peaked in 2006. Assuming average work trip travel distances, the smaller number of people working now would reduce travel per household by more than one percent (one-fifth of the household reduction).
Shopping Less Frequently due to Higher Gasoline Prices: According to the Nationwide Household and Transportation Survey (2009), the average household makes 468 shopping trips annually. If shopping trips were reduced by one quarter in response to higher gasoline prices, the reduction in travel per household would be enough, along with the work trip reductions, to account for all of the decline over the past five years.
Information Technology: Not Driving and Telecommuting Instead: Again, advances in information technology appear to have also added to the decline. Even while employment was falling, working at home (mainly telecommuting) increased almost 10 percent between 2006 and 2010 (latest data available) and telecommuting added six times as many commuters as transit. Working at home eliminates the work trip and is thus the most sustainable mode of access to employment. In just four years, in working at home removed as much automobile travel to work as occurs every day in the Salt Lake City metropolitan area.
More Information Technology: Not Driving and Texting Instead? Adie Tomer at the Brookings Institution notes a decline in the share of people 19 years and under who have drivers licenses as potentially contributing to the trend. She cites University of Michigan research by Michael Sivak and Brandon Schoettle, who documented the decline. Sivak told The Michigan Daily that "a major reason for the trend is the shift toward electronic communication among America’s youth, reducing the need for 'actual contact among young people.'"
Still More Information Technology: Not Driving and Shopping On-Line Instead? And, as with electronic communication and telecommuting, there is also an information technology angle to shopping. The substantial increase in on-line shopping could be reducing shopping trips.
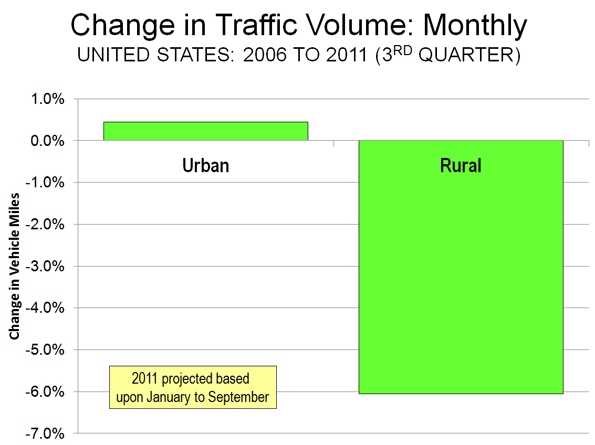
Not Making Intercity Trips? All of the loss in driving has been in rural areas, rather than urban areas. Since the employment peak in 2006, urban driving has increased 0.4 percent (though driving per household has decreased). By comparison, rural driving has declined 6.0 percent (Note). This much larger rural driving decline could be an indication that people have reduced discretionary travel, such as longer trips that extend beyond the fringes of urban areas (Figure). As with transit, however, it would be a mistake to characterize Amtrak as having attracted much of the reduced rural travel (or for that matter from airlines, see If Wishes were Iron Horses: Amtrak Gaining Airline Riders?). Over the period, Amtrak's gain (passenger mile) has been approximately one percent of the rural loss.
Not Driving and not Transferring to Transit: Transit ridership trends have been generally positive over the past decade. Since 2006, transit ridership has risen 3.4 percent. This compares to the 1.1 percent decline in automobile use. However, it would be incorrect to assume attraction to transit as contributing materially to the decline in driving. Because transit has such a small market, even this healthy increase has budged its urban market share (now approximately 1.7 percent) up by barely 0.5 percentage points.
Besides scale, there is another reason transit has not been the beneficiary of the driving reduction. Automobile competitive transit service is simply not accessible for most trips. For example, it is estimated that less than four percent of metropolitan jobs can be reached in 30 minutes by transit for the average metropolitan area resident. This compares to the more than 65 percent of automobile commuters who do reach their jobs in 30 minutes or less. In short, transit is not an alternative to the car for the vast majority of urban trips.
It does no good to suggest this can be materially improved by increasing transit service. The most lucrative transit markets are already served, and new ones would be more expensive. This is illustrated by the exorbitant cost of adding ridership. Over the most recent decade, transit ridership increased 21 percent, which required an expenditure increase of 59 percent, nearly three times as much.
Decentralization of Jobs and Residences: The 2010 census indicated that the American households continue to decentralize, increasingly choosing to live in single-family detached houses in the suburbs. The same trend has been occurring in employment locations, as Brookings Institution research indicates. Between 1998 and 2006, less than one percent of new employment was located within three miles of urban cores. Nearly 70 percent of the new jobs decentralized to outer suburban rings.
The continuing dispersion of jobs and residences could dampen the increase rate of driving in the years to come, as households have greater opportunities to live in the suburban surroundings they prefer, while also commuting to the more proximate jobs that have moved to the suburbs.
The Decline in Context: Among the potential causes, certainly the most important is the economic situation,with steeply declining household incomes and the worst economic situation since the 1930s. The longer term driving trends will be more apparent when (and if) prosperity restores healthy growth in employment. Moreover, with only a small part of travel being attracted to transit, a more significant shift could involve substitution of access by information technology (on-line). Even with the decline, however, there has been nothing like a "sea change" in how the nation travels.
Note: The data on driving is estimated from Federal Highway Administration (FHWA) reports. FHWA produces monthly preliminary estimates, which are subsequently adjusted in annual reports.
Wendell Cox is a Visiting Professor, Conservatoire National des Arts et Metiers, Paris and the author of “War on the Dream: How Anti-Sprawl Policy Threatens the Quality of Life”
Photograph: Harbor Freeway, Los Angeles


Changing Travel Demands: Implications For Transport Policy
Readers may be interested in other research concerning how demographic and economic trends are changing travel demands, and their implications for transport policy.
Per capita vehicle travel peaked in most developed countries about the year 2000, and total VMT peaked about 2007. This results from structural trends including aging population, rising fuel prices, improvements to alternative modes, increased urbanization, increasing health and environmental concerns, and changing consumer preferences. The research cited below indicates that in developed countries, motor vehicle travel is unlikely to grow much overall in the future; there may be modest increases in VMT in areas with significant population or industrial growth but most areas will see traffic volumes hold steady or decline in the future.
This has important implications for transport policy and planning. It indicates that traffic and parking congestion will be less important problems to address then in the past, while demand for alternatives (walking, cycling, public transit, telework and delivery services) will increase. Many people prefer to drive less and rely more on alternatives, provided that they are convenient, comfortable and affordable. For example, in response to rising fuel prices and increased health concerns, many parents would prefer to walk and bicycle their children to school, rather than chauffeur them each day, but this is only possible if communities invest more in sidewalks and bikepaths, and implement traffic calming and smart growth development policies that make non-motorized travel safer and easier. Similarly, many commuters would prefer to walk, bike, use public transit or telwork, if those options are convenient, comfortable and affordable. However, if communities fail to improve transport options, many households will continue to drive more than they actually want.
This indicates that resources currently dedicated to expanding roads and parking facilities should rationally be shifted to supporting other modes, and that development policies should support creation of more walkable and transit-oriented communities in response to changing consumer demands. For example, it will be rational to convert more parking and general traffic lanes to bus and bike lanes, to invest more in sidewalks and bikepaths, to reduce minimum parking requirements and limits on development density, and to invest more in high quality public transit services, to better satisfy our future needs (see my Blog, "Memo From Future Self: Hope For The Best But Prepare For the Worst" at http://www.planetizen.com/node/39418 ).
Mr. Cox understates the role that public transit improvements can play in reducing vehicle travel. High quality public transit (BRT and LRT, with supportive land use policies that create transit-oriented development) have a leverage effect (see "Evaluating Public Transit Benefits and Costs" at www.vtpi.org/tranben.pdf and "The Broader Connection between Public Transportation, Energy Conservation and Greenhouse Gas Reduction" at www.apta.com/research/info/online/documents/land_use.pdf), by helping to create communities where residents own fewer vehicles, drive fewer annual miles, and rely more on walking, cycling and public transport (see for example www.nctr.usf.edu/jpt/pdf/JPT11-3.pdf ). Where this occurs, each passenger-mile of travel on high-quality transit tends to reduce 3-10 vehicle-miles of travel. As a result, public transit service improvements that double transit ridership in a city, say from 2% to 4%, can reduce automobile travel by 5% to 20%, depending on factors such as the degree that transit improvements are integrated with supportive policies such as efficient parking and road pricing, and more compact land use development policies.
For more information see:
Phil Goodwin (2011), "Peak Car: Evidence Indicates That Private Car Use May Have Peaked And Be On The Decline," Urban Intelligence Network (www.rudi.net/node/22123 ).
Todd Litman (2005), “Changing Travel Demand: Implications for Transport Planning,” ITE Journal, Vol. 76, No. 9, September, pp. 27-33; at www.vtpi.org/future.pdf .
Todd Litman (2009), "Where We Want To Be: Home Location Preferences And Their Implications For Smart Growth," Victoria Transport Policy Institute; at www.vtpi.org/sgcp.pdf .
David Metz (2010), “Saturation of Demand for Daily Travel,” Transport Reviews, Vol. 30, Is. 5, pp. 659 – 674; summary at www.ucl.ac.uk/news/news-articles/1006/10060306 and www.eutransportghg2050.eu/cms/assets/Metz-Brussels-2-10.pdf.
Adam Millard-Ball and Lee Schipper (2010), “Are We Reaching Peak Travel? Trends in Passenger Transport in Eight Industrialized Countries,” Transport Reviews, Vol. 30 (http://dx.doi.org/10.1080/01441647.2010.518291); previous version at www.stanford.edu/~adammb/Publications/Millard-Ball%20Schipper%202010%20P....
Arthur C. Nelson (2006), “Leadership in a New Era: Comment on “Planning Leadership in a New Era,” Journal of the American Planning Association, Vol. 72, Is. 4, Dec. 2006 , pp. 393 – 409. Also see Arthur C. Nelson (2009), The New Urbanity: The Rise of a New America, University of Utah Metropolitan Research Center; summary at www.froogalizer.com/news/research-on-homeownership-rate-through-2030.htm....
Steven E. Polzin, Xuehao Chu and Nancy McGuckin (2011), "Exploring Changing Travel Trends, presented at Using National Household Travel Survey Data for Transportation Decision Making," Transportation Research Board; at http://onlinepubs.trb.org/onlinepubs/conferences/2011/NHTS1/Polzin2.pdf.
Michael Sivak and Brandon Schoettle (2011), "Recent Changes in the Age Composition of Drivers in 15 Countries", University of Michigan Transportation Research Institute; at www.lapri.org/sites/default/files/UMTRI-2011-43[1].pdf.
Clark Williams-Derry (2011), "Dude, Where Are My Cars?", Sightline Institute (www.sightline.org); at http://daily.sightline.org/blog_series/dude-where-are-my-cars.
========================
Todd Litman is founder and executive director of the Victoria Transport Policy Institute (www.vtpi.org), an independent research organization dedicated to developing innovative solutions to transport problems.
Keep dreaming
Very plausible.. if it were not a situation being played out in many different countries/areas with widely varying movement characteristics, and beginning before the "economic situation".
Wake up and smell the coffee.
Local to me:
http://www.stuff.co.nz/auckland/local-news/6192160/Aucklanders-ditch-car...
http://transportblog.co.nz/2011/12/27/peak-traffic/
http://transportblog.co.nz/2011/12/29/peak-traffic-ctd/
...and I'm sure there is plenty more data reported from other countries. Objectively.
Tim Robinson
Auckland, NZ
Especially fiber-optic broadband to the home
You wrote:
Information Technology: Not Driving and Telecommuting Instead: Again, advances in information technology appear to have also added to the decline. Even while employment was falling, working at home (mainly telecommuting) increased almost 10 percent between 2006 and 2010 (latest data available) and telecommuting added six times as many commuters as transit. Working at home eliminates the work trip and is thus the most sustainable mode of access to employment. In just four years, in working at home removed as much automobile travel to work as occurs every day in the Salt Lake City metropolitan area.
Absolutely correct. As broadband service to the home has become faster and more-reliable, sometimes provided by firms usually known as cable TV providers like Comcast and Cox, sometimes provided by telephone companies like Verizon (both the older DSL service and the newer fiber-optic FiOS), it has become possible for more and more people to work at home.
You forgot one
http://www.grist.org/transportation/2011-12-27-driving-has-lost-its-cool...
Dave Barnes
+1.303.744.9024
and another one
http://www.bikewalktwincities.org/news-events/bicycling-and-walking-coun...
Tim Robinson
Auckland, NZ
Twin Cities Numbers Make Me Laugh
Tim, I've long seen "great" bicycling numbers and walking number coming out of the Twin Towns. I just don't see the same thing happening on the streets. There are some social trends going on where increases are occurring but I suspect this is largely driven by how people believe they're supposed to answer or simply poorly done surveys. I'm afraid the latter is happening with organizations like the one you linked. Even during a mild winter like the one we've had so far, the numbers aren't consonant with what is seen out on the streets in MPLStown and STPLville.