
Americans may be less mobile than in the past, but millions since 2000 have continued to be on the move, reshaping the landscape and economy of the nation. Three maps will be briefly discussed: one of population change by county, 2000-2007, one of net internal migration by county, and one of net immigration from abroad. We will then focus on the “extremes”, unusually large levels or intensities of net internal migration and of immigration.
Overall population growth
As was true in the 1990s, big growth has concentrated overwhelmingly in selected metropolitan regions --- and within them, primarily in their suburbs and exurbs. The big growth areas are concentrated in Texas (Houston, Dallas-Fort Worth, San Antonio, Austin), greater Atlanta, North Carolina (Charlotte-Raleigh), most of Florida, the Virginia and Maryland suburbs of Washington-Baltimore, the desert Southwest (Riverside-San Bernardino, Las Vegas, Phoenix, Tucson). Substantial exurban or spillover growth was common, with the Bay Area extending into California Central Valley, in far exurban New York and Pennsylvania as well as in largely once rural counties around such places as Salt Lake City, Denver, Portland, Seattle, Minneapolis, Chicago, Kansas City, Nashville, Indianapolis and Columbus.
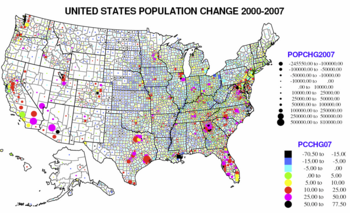 Many smaller metropolitan areas grew, especially in the south and west. Many counties with universities appear to have also grown, notably in the South. Many rural or small-town counties with substantial growth boasted environmental amenities and a strong ‘quality of life’ appeal.
The only big population losses were New Orleans and vicinity, but there were also vast rural small town areas with small losses, characterized by continuing out-migration, but often also by natural decrease, more deaths than births (870 counties), and covering the Great Plains, but also much of the Midwest, Appalachia and the Northeast.
Overall the population grew by 20 million, 12 million from natural increase, and 8 million from immigration. Around 80 million Americans “migrated” (moved across a county line), 28 percent of the population, resulting in net gains of over 10 million in gaining areas, and net losses of the same 10 million to losing areas.
Immigration
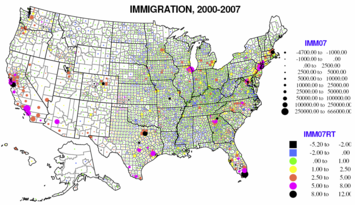 Net immigration into the US was almost 8 million in seven years, raising the legal/known share of the foreign born to almost 12 percent of the population. There were hundreds of counties --- rural, small town and small metropolitan --- where immigrants landed to take agricultural and industrial jobs or to work in service jobs or in construction. This trend is exemplified by a set of counties in far southwestern Kansas (which also had high internal out-migration—mostly Hispanics moving to meat-packing jobs) and to environmental amenity ski-resort counties in Colorado (construction, service).
The largest immigration flows continued to flow to metropolitan areas, including many large core central counties, many of which were losing heavily among domestic migrants to their suburban and exurban fringe counties. The 21 largest losing counties lost a net of 4.7 million, but gained 3.5 million immigrants. Some 40 percent of the 8 million immigrants were destined for just 8 metropolitan cores, most notably Los Angeles-San Diego, New York City, Miami-Fort Lauderdale, San Francisco-Oakland-San Jose, Chicago, Dallas-Fort Worth and Houston.
Internal Migration
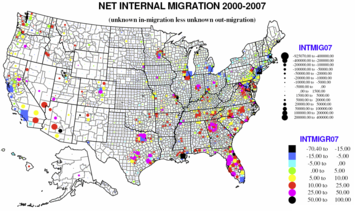 The story of gains and losses from internal migration is a little more complex. Gaining counties attracted around 45 million migrants and sent out around 35 million, for a net gain of over 10 million. One obvious feature from the maps is the “donut” phenomenon, the prevalence of large central county net out-migration, surrounded by a ring of substantial suburban and exurban net in-migration (about two-thirds of which is from the central core counties).
This pattern is particularly marked in Houston, Dallas, Miami, Minneapolis, Washington, DC., Atlanta, Denver, Portland, Kansas City, Memphis, Nashville, and Indianapolis. In the cases of Los Angeles, San Francisco, Seattle, New York and Philadelphia, the ring of growth has pushed beyond the suburban counties to adjacent areas – as to the Central Valley of California or to NE Pennsylvania and Delaware.
Some core areas did gain, mostly and Southern communities such as Phoenix, Las Vegas, San Antonio, Charlotte and Raleigh, NC, and Knoxville, TN --- southern and of more recent importance. In many of these areas the “core” county also includes many areas which might be considered suburban. In this sense, the fastest “urban growth” took place in relatively low-density, auto-dominated regions as opposed to traditional urban cores. Finally, and most obvious on the map, is the continuing high growth of central Florida across most counties.
In contrast there are places so hurt by de-industrialization that the entire (or most) of the metropolitan areas have substantial out-migration. These include places like Detroit, Cleveland, Pittsburgh, Buffalo, Rochester, and Boston. In some places, notably Pittsburgh, even suburban areas are losing population.
Rural and small towns also show their own dynamics. There is also continued net-out-migration for almost half of rural small –town counties in all parts of the country, but especially in the Great Plains and Midwest and in the Mississippi delta. But on the other hand, we can see continuing f net in-migration to environmentally attractive areas, often for retirement or recreation, notably in parts of the west, but also in the Ozarks and other areas in the south, upper Midwest and Northeast.
Conclusion
The constants here are (1) the restless mobility of the population, (2) the dominance of suburban growth; and (3) the continuing decline of more than half of rural small-town counties. Prominent in recent years, but uncertain in the longer run are (4) our strong dependence on immigration (40 percent of net national growth), (5) the locus of fastest growth in exurbia, (6) the decline of northeastern and Midwestern industrial regions; (7) the rapid growth or rural environmental amenity counties and (8) the specific set of fast-growing metropolitan areas.
Given the severity of economic conditions, immigration could begin to slow as a result of declining employment opportunities or political opposition. Similarly exurban expansion could slow because of the housing credit collapse. It is not impossible that older industrial areas could partially recover (ample plant and housing stock) while environmental amenity areas could be hurt by recession and the housing collapse. This could also apply to some of the fastest gaining areas 2000-2005 --- notably Florida and southern California --- that have been the hardest hit in the 2007 on housing debacle.
But I believe American society is resilient, and even with needed constraints on excessive housing finance abuses, and even if we are indeed approaching the era of “peak oil,” the geographic settlement pattern of recent decades most likely will persist. People will continue to migrate for the same reasons they have for decades --- in search of cheaper, larger houses, for jobs, warmer weather or scenic beauty. So we can expect, as the financial crisis gradually recedes, continued growth in suburban, exurban and satellite zones of metropolitan areas, and a net flow southward and to amenity areas.
Richard Morrill is Professor Emeritus of Geography and Environmental Studies, University of Washington. His research interests include: political geography (voting behavior, redistricting, local governance), population/demography/settlement/migration, urban geography and planning, urban transportation (i.e., old fashioned generalist)


Those millions on the move
Those millions on the move are the people that keep the moving industry alive. I run a moving service company and it takes a lot of intuitiveness to make things right, strategic areas are those who lead to real profits. Also the internet is a great boost for this kind of business.
Maroon at Austin movers