
Tokyo continues to be the world's largest urban area with more than 37 million people, according to the recently released 9th Annual edition of Demographia World Urban Areas. Tokyo has held the top position for nearly 60 years, since it displaced New York. There have been only modest changes in the ranking of the world's largest urban areas over the past year. The top four urban areas remain the same, with Jakarta (Jabotabek) second, Seoul third and Delhi fourth. Fast-growing Shanghai, however, assumed fifth place, displacing Manila where the latest census data showed less population growth than had been expected (Table 1).
| Table 1 | |||||||
| LARGEST URBAN AREAS IN THE WORLD | |||||||
| Rank | Geography | Urban Area | Population Estimate | Land Area: Square Miles | Density | Land Area: Square Kilometers | Density |
| 1 | Japan | Tokyo-Yokohama | 37,239,000 | 3,300 | 11,300 | 8,547 | 4,400 |
| 2 | Indonesia | Jakarta (Jabotabek) | 26,746,000 | 1,075 | 24,900 | 2,784 | 9,600 |
| 3 | South Korea | Seoul-Incheon | 22,868,000 | 835 | 27,400 | 2,163 | 10,600 |
| 4 | India | Delhi, DL-HR-UP | 22,826,000 | 750 | 30,400 | 1,943 | 11,800 |
| 5 | China | Shanghai, SHG | 21,766,000 | 1,350 | 16,100 | 3,497 | 6,200 |
| 6 | Philippines | Manila | 21,241,000 | 555 | 38,300 | 1,437 | 14,800 |
| 7 | Pakistan | Karachi | 20,877,000 | 310 | 67,300 | 803 | 26,000 |
| 8 | United States | New York, NY-NJ-CT | 20,673,000 | 4,495 | 4,600 | 11,642 | 1,800 |
| 9 | Brazil | Sao Paulo | 20,568,000 | 1,225 | 16,800 | 3,173 | 6,500 |
| 10 | Mexico | Mexico City | 20,032,000 | 790 | 25,400 | 2,046 | 9,800 |
| 11 | China | Beijing, BJ | 18,241,000 | 1,350 | 13,500 | 3,497 | 5,200 |
| 12 | China | Guangzhou-Foshan, GD | 17,681,000 | 1,225 | 14,400 | 3,173 | 5,600 |
| 13 | India | Mumbai, MAH | 17,307,000 | 211 | 82,000 | 546 | 31,700 |
| 14 | Japan | Osaka-Kobe-Kyoto | 17,175,000 | 1,240 | 13,900 | 3,212 | 5,300 |
| 15 | Russia | Moscow | 15,788,000 | 1,700 | 9,300 | 4,403 | 3,600 |
| 16 | Egypt | Cairo | 15,071,000 | 640 | 23,500 | 1,658 | 9,100 |
| 17 | United States | Los Angeles, CA | 15,067,000 | 2,432 | 6,200 | 6,299 | 2,400 |
| 18 | India | Kolkota, WB | 14,630,000 | 465 | 31,500 | 1,204 | 12,100 |
| 19 | Thailand | Bangkok | 14,544,000 | 900 | 16,200 | 2,331 | 6,200 |
| 20 | Bangladesh | Dhaka | 14,399,000 | 125 | 115,200 | 324 | 44,500 |
| 21 | Argentina | Buenos Aires | 13,776,000 | 1,020 | 13,500 | 2,642 | 5,200 |
| 22 | Iran | Tehran | 13,309,000 | 525 | 25,400 | 1,360 | 9,800 |
| 23 | Turkey | Istanbul | 12,919,000 | 520 | 24,800 | 1,347 | 9,600 |
| 24 | China | Shenzhen, GD | 12,506,000 | 675 | 18,500 | 1,748 | 7,200 |
| 25 | Nigeria | Lagos | 12,090,000 | 350 | 34,500 | 907 | 13,300 |
| 26 | Brazil | Rio de Janeiro | 11,616,000 | 780 | 14,900 | 2,020 | 5,700 |
| 27 | France | Paris | 10,869,000 | 1,098 | 9,900 | 2,845 | 3,800 |
| 28 | Japan | Nagoya | 10,183,000 | 1,475 | 6,900 | 3,820 | 2,700 |
| Source: Demographia World Urban Areas (2013) | |||||||
Provisional census results moved Karachi into the top 10 for the first time, while two urban areas, Bangkok and Tehran, reached megacities status (over 10 million population), reflecting strong growth and the availability of more precise data for estimation.
As before, the most dense megacity was Dhaka, Bangladesh, at 115,000 per square mile (45,000 per square kilometer). New York continues to have the largest urban footprint, covering nearly 4,500 square miles (more than 11,500 square kilometers) and the least dense megacity in the world.
Coverage
This year's Demographia World Urban Areas report provides current and coordinated population, urban land area and density data for all 875 identified urban areas with 500,000 population or more as well as estimates for 650 smaller urban areas. The report includes a total population of approximately 1.86 billion in urban areas with 500,000 or more population and an overall population for urban areas of all sizes of 2.0 billion. These urban areas account for approximately 53% of the world's urban population.
Distribution of Population by Urban Area Size
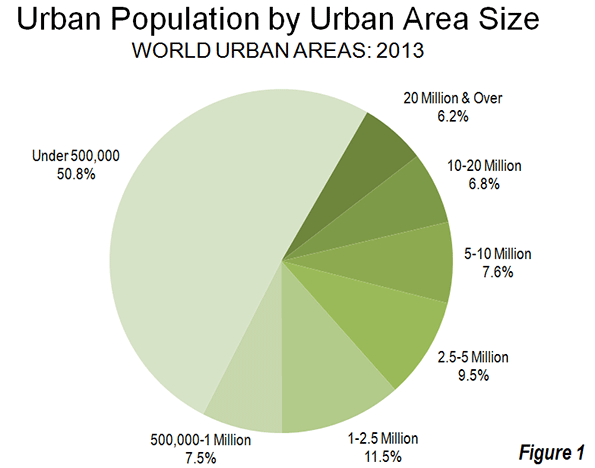
As was noted in What is a Half Urban World? a considerable share of the world's urban population lives in smaller urban areas (as small as 200 population). In 2013 is estimated that 51% of the world's urban population lives in urban areas with less than 500,000 population, based on the data in Demographia World Urban Areas. The 10 largest urban areas, each with over 20 million population, account for approximately 6% of the urban population while the 28 megacities, each with more than 10 million population, account for 13% of the population. Approximately 21% of the urban population is in the more than 375 urban areas with between 1 million and 5 million population (Figure 1).
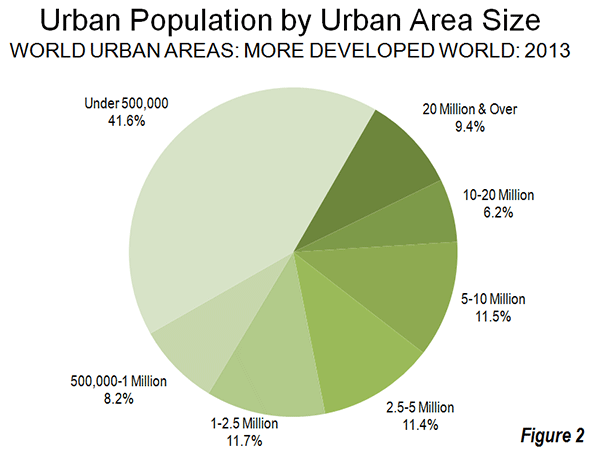
The share of the population in larger urban areas is greater in the more developed world than in the developing world. Only 42% of the population lives in urban areas with less than 500,000 population in the more developed world. The share of the population in megacities is greater than the world figure, at approximately 16% (Figure 2).
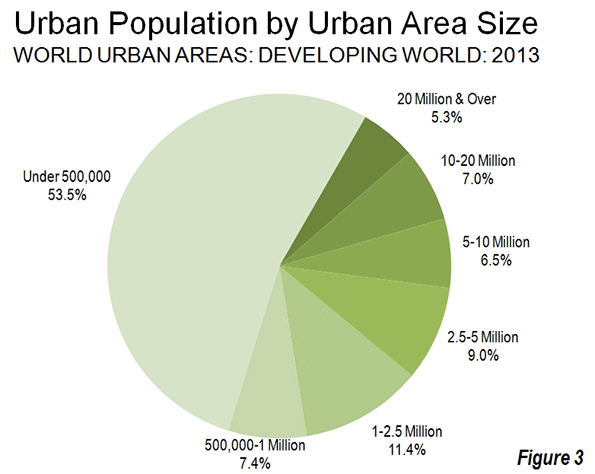
A larger share of the population is in smaller urban areas in the developing world, at 54%. Combined, 13% of the developing world population is in the megacities and 20% of the population is in urban areas with between 1 million and 5 million population (Figure 3).
Distribution of Population by Urban Area Size
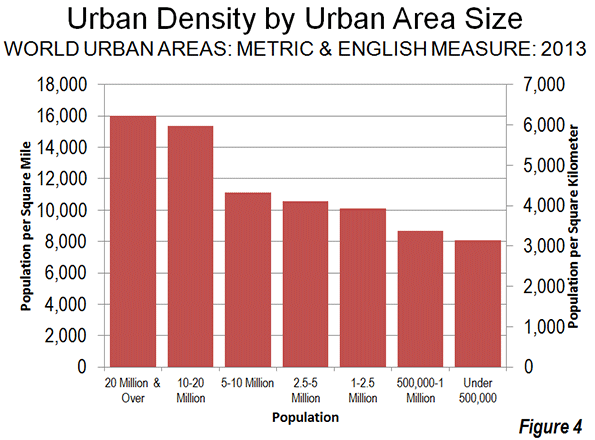
Generally, the larger urban areas have higher average population densities than smaller urban areas (Figure 4). Overall, the urban areas with more than 20 million population have a density of approximately 16,000 per square mile (6,200 per square kilometer), while urban areas between 10 million and 20 million population are nearly as dense at 15,400 per square mile (6,000 per square kilometer). The urban areas with from 5 million to 10 million population are considerably less dense, at 11,100 per square mile (4300 per square kilometer). The smallest urban areas (Note), below 500,000 population are estimated to have a density of approximately 8,100 per square mile (3,100 per square kilometer).
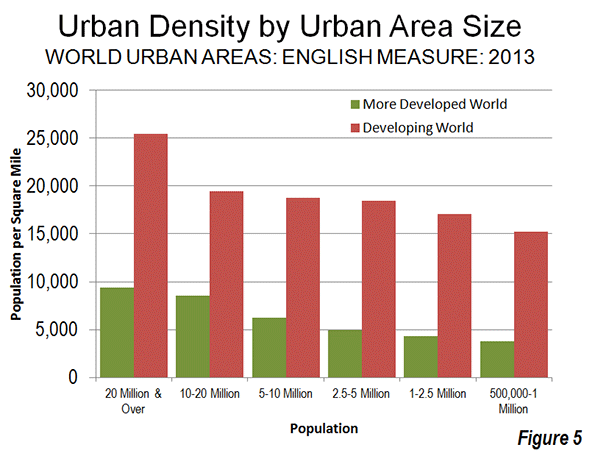
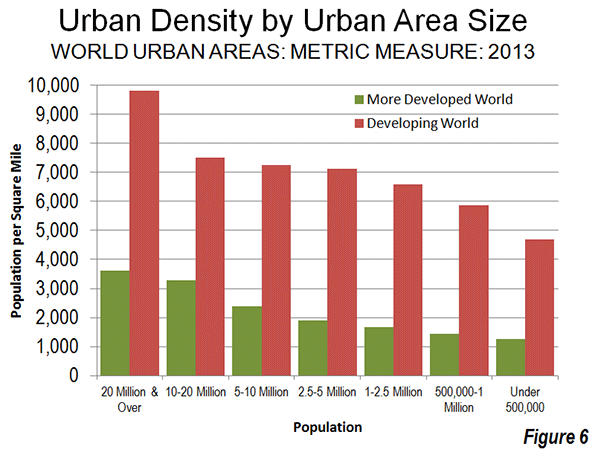
A similar relationship exists in both the more developed and developing world, with the largest urban areas being considerably more dense than smaller urban areas. The megacities in the more developed world have an average population density of approximately 9,000 per square mile (3,600 per square kilometer), compared to 3,700 per square mile (1,400 per square kilometer) for urban areas in the 500,000 to one million population range.
However, urban areas in the developing world are considerably more dense in the less developed world, to be expected given the relationship between lower incomes and higher population densities. Developing world megacities are approximately 2.5 times as dense as megacities in the more developed world. The differences are even greater in smaller urban areas. Developing world urban with less than 5 million population are approximately four times as dense as those in the more developed world (Figures 5 and 6).
However, megacities in both the more developed and developing world have both population growth and decreasing densities in common. This is illustrated in an examination of megacity trends, which indicates that in recent decades, all 23 examined experienced falling densities. The same is also true of the other five megacities (Karachi, Teheran, Lagos and Paris), which will be described in greater detail in future articles. (see Dispersion in the World's Urban Areas). Cities everywhere are continuing to expand organically, with nearly all growth on the periphery.
Distribution of Large Urban Areas
The world's largest urban areas are increasingly located in the developing world. Only three of the 10 urban areas with more than 20 million are located in the more developed world, Tokyo, Seoul and New York. Among the 28 megacities, only seven are in the more developed world. More than three quarters of the urban areas with 500,000 or more population are located in the developing world (658 of 875). There is a similar ratio with respect to population, with developing world urban areas having approximately 2.9 million population, while the urban population in the more developed world is approximately 850 million (Table 2).
| Table 2 | ||||
| DISTRIBUTION OF WORLD URBAN AREAS BY SIZE | ||||
| Population | More Developed World | Developing World | World | Share in Developing World |
| 20 Million & Over | 3 | 7 | 10 | 70.0% |
| 10-20 Million | 4 | 14 | 18 | 77.8% |
| 5-10 Million | 15 | 26 | 41 | 63.4% |
| 2.5-5 Million | 28 | 76 | 104 | 73.1% |
| 1-2.5 Million | 65 | 217 | 282 | 77.0% |
| 500,000-1 Million | 102 | 318 | 420 | 75.7% |
| Total | 217 | 658 | 875 | 75.2% |
| Source: Demographia World Urban Areas (2013) | ||||
The Future of Urbanization
This concentration of urbanization in the developing world is likely to become much greater in the decades to come. According to the United Nations, urban population will increase more than 2.5 billion between 2010 and 2050 in less developed regions, compared to less than 150 million in its more developed regions. By 2050, more than 85 percent of the world's urbanization is expected to be in today's less developed regions.
Wendell Cox is a Visiting Professor, Conservatoire National des Arts et Metiers, Paris and the author of “War on the Dream: How Anti-Sprawl Policy Threatens the Quality of Life.
--------
Note: The population density of urban areas under 500,000 is estimated by applying ratios from, Making Room for a Planet of Cities(Shlomo Angel, with Jason Parent, Daniel L. Civco, and Alejandro M. Blei) to the Demographia data.
Photo: Travel by bajaj in Jakarta (by author)


