
One of the most important turning points in the social history of the United States occurred at the beginning of the 1940s. This is not about Pearl Harbor or the Second World War, but rather about the economic, housing and transportation advances that have produced more affluence for more people than ever before in the world.
After being delayed by World War II, people began moving from the overcrowded cities to spacious (for that time) houses in the suburbs. They increasingly traveled to work and other destinations by car. These trends were at least two decades old at the time, but had been put on hold by the Great Depression. The prewar city (metropolitan area) was considerably denser, more oriented to mass transit and largely monocentric. By 2010, all major metropolitan areas had developed an urban form that was overwhelmingly suburban and polycentric, with the rise of edge cities and the even greater dispersion of edgeless cities. On average, areas outside the traditional downtowns (central business districts) accounted for 90 percent of metropolitan employment in 2000, ranging from a high of more than 95 percent in metropolitan areas like Phoenix, San Jose and Tampa-St. Petersburg to a low of 80 percent in New York.
Rating Metropolitan Areas by Pre-War Residential Development
Although dense urban cores persist in most metropolitan areas, their size and significance varies greatly. This can be illustrated by data from the 2007- 2011 American Community Survey, which makes it possible to rank metropolitan areas by their shares of pre-World War II residential development.
This article uses the percentage of dwelling units, both owner and renter occupied constructed before 1940 to rate the ages of the nation's 51 major metropolitan areas (those with more than 1 million population in 2010). Overall, America’s major metropolitan areas are overwhelmingly postwar in their urban development, with approximately 14% of residences built before 1940. By comparison the 1940 populations of today's major metropolitan counties were just 35 percent of their 2010 populations.
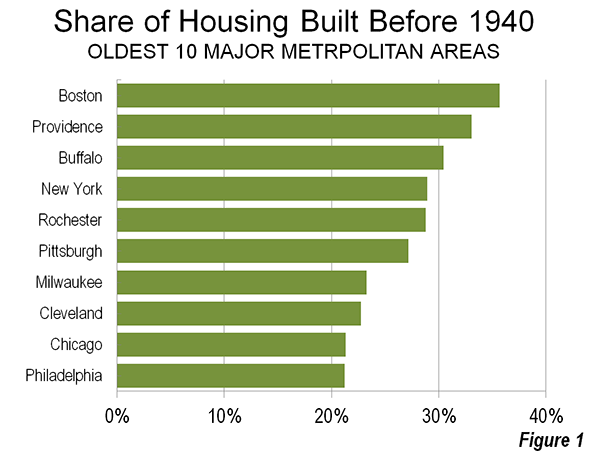
Oldest Metropolitan Areas
The nation's oldest metropolitan areas, not surprisingly, are concentrated in the Northeast and the upper Midwest. Overall population growth has been modest in these regions compared especially to the South and the West.
- Boston is the oldest with 35.7% of its residences built before 1940. This varies from 55.6% in the historical core city of Boston to roughly 32 percent in the suburbs, which are the oldest themselves in the country.
- Nearby Providence is the second oldest metropolitan area, with 33.1% of its dwellings built before 1940. The city of Providence is also the second oldest among historical core municipalities, at 58.8%. Providence overall share of pre-1940 housing stands at 30.2%. It is notable that the Office of Management and Budget now considers Boston and Providence to be in the same combined statistical area (consolidated metropolitan area).
- Buffalo is the nation's third oldest metropolitan area with 30.5% of its residences preceding 1940. The core city of Buffalo is the oldest historical core municipality, with 62.8% of its housing predating 1940. Buffalo suburbs, however, are considerably newer, with only 20.1% older than 1940.
- New York is the nation's fourth oldest metropolitan area, with 28.9% of its dwellings having been built before 1940. The city of New York has a much lower prewar housing percentage than the top four, largely because of the substantial amount of green field housing built in the more distant sections of Queens and especially in Staten Island during the 1950s and 1960s. New York's suburbs, which have accounted for nearly all of the growth in the metropolitan area have a pre-1940 housing share of 18.9%.
- Rochester is the nation's fifth-oldest metropolitan area, with 28.8% of its housing prewar. The historical core municipality of Rochester has a high 58.1% of its housing in prewar stock, while the suburbs have a 21.1% share.
The next five oldest metropolitan areas are Pittsburgh, at 27.2%, Milwaukee and 23.3%, Cleveland 22.7% Chicago and 21.3% and Philadelphia at 21.2%. Among these, the oldest historical core municipalities are Cleveland, at 51.9% and Pittsburgh at 50.3%. Pittsburgh has the highest suburban pre-1940 housing stock, at 23.5%, the third highest in the nation after Boston and Providence (Figure 1).
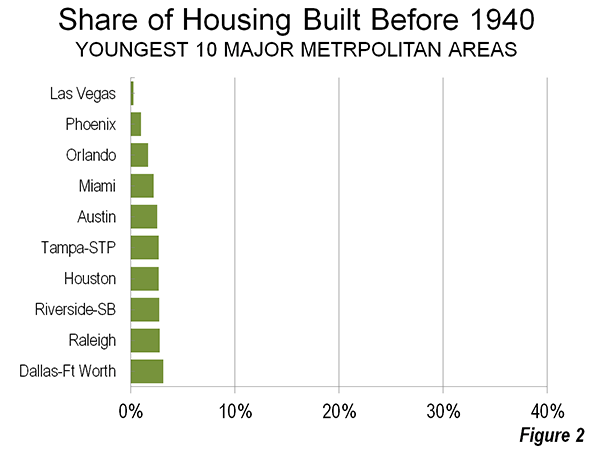
Youngest Metropolitan Areas
The nation's youngest major metropolitan areas are concentrated in the South and West, comprising 28 of the 51.
- Las Vegas is the youngest major metropolitan area. "Sin City" has had the greatest percentage population growth since 1940, and is now approaching a population of 2 million, compared to less than 20,000 in 1940. Only 0.3% of the housing stock in Las Vegas was built pre-war.
- Phoenix, which is grown from little more than 200,000 people in 1940 to more than 4 million people today, has a pre-1940 housing stock of only 1.0%. The city of Phoenix has a miniscule pre-1940 housing stock of 1.9%.
- The third youngest major metropolitan area is Orlando with 1.7% of its housing stock having been built before 1940.
- Perhaps surprisingly, Miami is the fourth youngest major metropolitan area with only 2.2% predating 1940. The historical core municipality of Miami, however, has one of the highest densities in the United States and a comparatively strong 10.6% of its housing is prewar.
- Austin is the fifth youngest major metropolitan area, with 2.5% of its housing predating the war.
Tampa St. Petersburg, Houston, Riverside-San Bernardino, Raleigh and Dallas-Fort Worth round out the 10 youngest major metropolitan areas. Each of these has a pre-1940 housing stock between 2.7% and 3.1% (Figure 2).
Data for all metropolitan areas is provided in the table.
| Table | |||||||
| Share of Housing Units Constructed Before 1940 | |||||||
| US Metropolitan Areas Over 1,000,000 Population in 2010 | |||||||
| Rank | Metropolitan Area | Metropolitan Area | Historical Core Municipality(s) | Rank | Suburbs | Rank | HCM |
| 1 | Boston, MA-NH | 35.7% | 55.6% | 4 | 32.4% | 1 | 1 |
| 2 | Providence, RI-MA | 33.1% | 58.8% | 2 | 30.2% | 2 | 1 |
| 3 | Buffalo, NY | 30.5% | 62.8% | 1 | 20.1% | 5 | 1 |
| 4 | New York, NY-NJ-PA | 28.9% | 41.3% | 12 | 18.9% | 6 | 1 |
| 5 | Rochester, NY | 28.8% | 58.1% | 3 | 21.1% | 4 | 1 |
| 6 | Pittsburgh, PA | 27.2% | 50.3% | 7 | 23.5% | 3 | 1 |
| 7 | Milwaukee,WI | 23.3% | 38.9% | 16 | 14.0% | 10 | 1 |
| 8 | Cleveland, OH | 22.7% | 51.9% | 6 | 15.4% | 8 | 1 |
| 9 | Chicago, IL-IN-WI | 21.3% | 43.8% | 10 | 11.6% | 13 | 1 |
| 10 | Philadelphia, PA-NJ-DE-MD | 21.2% | 39.1% | 14 | 14.9% | 9 | 1 |
| 11 | San Francisco-Oakland, CA | 20.4% | 45.5% | 9 | 9.2% | 15 | 1 |
| 12 | Hartford, CT | 19.3% | 43.1% | 11 | 16.7% | 7 | 1 |
| 13 | Cincinnati, OH-KY-IN | 17.2% | 41.3% | 13 | 12.6% | 11 | 1 |
| 14 | St. Louis,, MO-IL | 15.8% | 54.4% | 5 | 10.3% | 14 | 1 |
| 15 | Minneapolis-St. Paul, MN-WI | 15.0% | 46.7% | 8 | 6.1% | 24 | 1 |
| 16 | Baltimore, MD | 14.4% | 39.0% | 15 | 6.8% | 22 | 1 |
| 17 | Portland, OR-WA | 13.1% | 31.8% | 19 | 5.5% | 25 | 2 |
| 18 | Columbus, OH | 12.5% | 12.6% | 31 | 12.4% | 12 | 2 |
| 19 | Louisville, KY-IN | 12.3% | 16.9% | 27 | 8.1% | 20 | 2 |
| 20 | Indianapolis. IN | 12.1% | 15.6% | 28 | 8.8% | 16 | 2 |
| 21 | Los Angeles, CA | 12.0% | 20.2% | 26 | 8.3% | 18 | 2 |
| 22 | Detroit, MI | 12.0% | 31.7% | 22 | 8.2% | 19 | 1 |
| 23 | Kansas City, MO-KS | 11.9% | 21.5% | 24 | 8.8% | 17 | 2 |
| 24 | New Orleans. LA | 11.7% | 31.7% | 21 | 3.0% | 35 | 1 |
| 25 | Seattle, WA | 11.1% | 29.9% | 23 | 6.1% | 23 | 2 |
| 26 | Richmond, VA | 9.0% | 32.0% | 18 | 4.1% | 31 | 2 |
| 27 | Salt Lake City, UT | 8.9% | 31.8% | 20 | 3.1% | 34 | 2 |
| 28 | Washington, DC-VA-MD-WV | 8.6% | 36.1% | 17 | 4.6% | 29 | 1 |
| 29 | Denver, CO | 7.1% | 21.4% | 25 | 2.1% | 43 | 2 |
| 30 | Birmingham, AL | 6.8% | 15.6% | 29 | 4.5% | 30 | 2 |
| 31 | Oklahoma City, OK | 6.7% | 8.8% | 34 | 4.9% | 27 | 2 |
| 32 | Memphis, TN-MS-AR | 5.6% | 8.8% | 35 | 2.3% | 41 | 2 |
| 33 | Virginia Beach-Norfolk, VA-NC | 5.4% | 1.1% | 50 | 7.0% | 21 | 2 |
| 34 | San Jose, CA | 5.3% | 5.5% | 42 | 5.1% | 26 | 3 |
| 35 | Nashville, TN | 5.1% | 6.9% | 39 | 3.9% | 33 | 2 |
| 36 | San Antonio, TX | 5.1% | 5.7% | 40 | 4.1% | 32 | 2 |
| 37 | Sacramento, CA | 4.6% | 11.5% | 32 | 2.7% | 36 | 3 |
| 38 | San Diego, CA | 4.3% | 7.0% | 38 | 2.1% | 42 | 2 |
| 39 | Charlotte, NC-SC | 4.0% | 3.3% | 46 | 4.6% | 28 | 2 |
| 40 | Jacksonville, FL | 3.8% | 4.7% | 43 | 2.3% | 40 | 2 |
| 41 | Atlanta, GA | 3.2% | 14.5% | 30 | 2.0% | 45 | 2 |
| 42 | Dallas-Fort Worth, TX | 3.1% | 5.7% | 41 | 2.5% | 38 | 2 |
| 43 | Raleigh, NC | 2.8% | 3.1% | 47 | 2.6% | 37 | 3 |
| 44 | Riverside-San Bernardino, CA | 2.7% | 7.9% | 37 | 2.5% | 39 | 3 |
| 45 | Houston, TX | 2.7% | 4.6% | 45 | 1.6% | 47 | 2 |
| 46 | Tampa-St. Petersburg, FL | 2.7% | 8.4% | 36 | 1.9% | 46 | 2 |
| 47 | Austin, TX | 2.5% | 3.0% | 48 | 2.0% | 44 | 3 |
| 48 | Miami, FL | 2.2% | 10.6% | 33 | 1.5% | 48 | 2 |
| 49 | Orlando, FL | 1.7% | 4.7% | 44 | 1.3% | 49 | 3 |
| 50 | Phoenix, AZ | 1.0% | 1.9% | 49 | 0.6% | 50 | 3 |
| 51 | Las Vegas, NV | 0.3% | 0.3% | 51 | 0.3% | 51 | 3 |
| Total | 13.6% | 25.5% | 9.0% | ||||
Notes:
Calculated from American Community Survey 2007-2011
HCM: Historical core municipality category: (1) Pre-War & Non-Suburban, (2) Pre-War & Suburban, (3) Post-War Suburban. There is one HCM per metropolitan area, except in in San Francisco-Oakland (San Francisco and Oakland) and Minneapolis-St. Paul (Minneapolis & St. Paul). Otherwise, the HCM is the first named municipality in the metropolitan area name, except in Virginia Beach-Norfolk, where it is Norfolk and Riverside-San Bernardino, where it is San Bernardino.
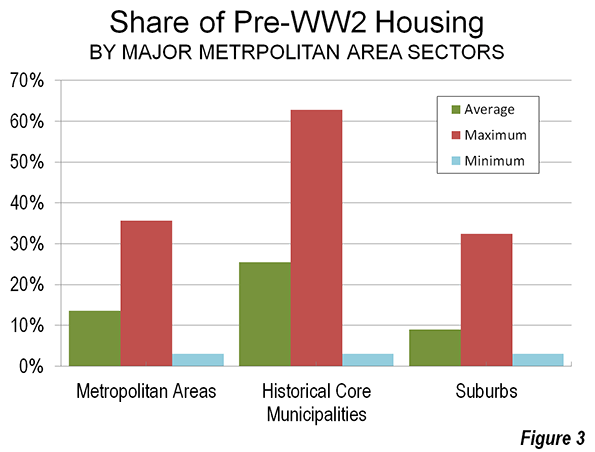
Not All Core Cities are the Same
This analysis indicates the substantial differences between not only the nation's metropolitan areas, but even more the differences between the core municipalities. For example, the core cities of Phoenix and Philadelphia have approximately the same population. Yet they could not be more different. Philadelphia has a long history, including a time as the nation's largest city around the period of the Revolutionary War. Phoenix, in contrast, is a product of the post-World War II boom. By 2010, Phoenix had become the nation's 6th largest municipality. Its 65,000 population in 1940 would rank it around 600th today. Figure 3 shows the average, maximum and minimum pre-war housing stock percentages by metropolitan area, historical core municipality and suburbs.
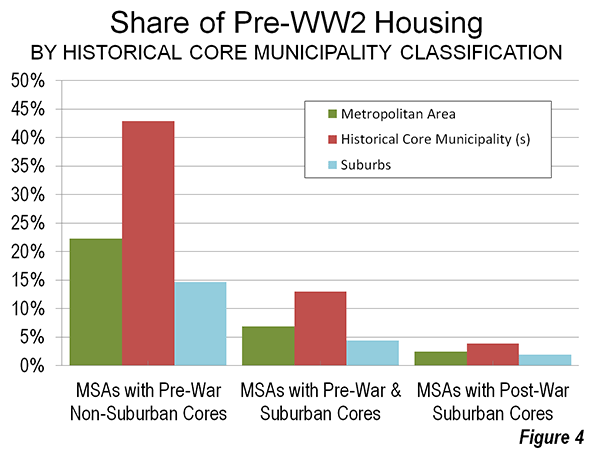
Categorizing Core Municipalities
In Suburbanized Core Cities, we classified the nation's core municipalities into three categories, based upon the extent of their pre-automobile development (This was described further in a paper co-authored with Peter Gordon of the University of California, Cities in Western Europe and America: Do Policy Differences Matter?).
The categories included "Pre-War Non-Suburban," which are core municipalities that were of high density in 1940 and have expanded their boundaries little since that time. Philadelphia, Baltimore and Providence are examples of these. The second category was "Post-War and Suburban," which includes municipalities that had a dense core of more than 100,000 residents in 1940, but contain large swaths of post-War suburban development (such as Los Angeles, Milwaukee and Atlanta). The third category was Post-War Suburban, which includes core cities that had little or no dense urban core in 1940 (such as Phoenix, Austin and San Jose).
Figure 4 illustrates the huge differentials in the pre-1940 housing stock between the metropolitan areas as classified by their historical core municipalities.
Commonalities
Even so, metropolitan areas are much more similar than their historical core municipalities. The bottom line is one different than one tends to hear in the urban-core-oriented press. In most of America the detached house predominates and virtually all development since 1940 has been suburban, both inside and outside the historical core municipalities.
Wendell Cox is a Visiting Professor, Conservatoire National des Arts et Metiers, Paris and the author of “War on the Dream: How Anti-Sprawl Policy Threatens the Quality of Life.”
----
Photograph: Boston (by author)


Most of the time I don’t
Most of the time I don’t make comments on websites, but I'd like to say that this article really forced me to do so. Really nice post!
how to get rid of vitiligo naturally
outdoor solutions ltd
outdoor solutions ltd
I was surfing net and
I was surfing net and fortunately came across this site and found very interesting stuff here. Its really fun to read. I enjoyed a lot. Thanks for sharing this wonderful information.
girlfriend activation system wiki
I should say only that its
I should say only that its awesome! The blog is informational and always produce amazing things.
wordpress directory theme
Wow! What an eye opener this
Wow! What an eye opener this post has been for me. Very much appreciated, bookmarked, I can’t wait for more!
http://familyselfdefencereviews.com
Your music is amazing. You
Your music is amazing. You have some very talented artists. I wish you the best of success.
legend of zelda sheet music
This is such a great
This is such a great resource that you are providing and you give it away for free.
junk car removal
This is such a great
This is such a great resource that you are providing and you give it away for free.
Veritas Atlanta
Im no expert, but I believe
Im no expert, but I believe you just made an excellent point. You certainly fully understand what youre speaking about, and I can truly get behind that.
go back
voyance cartes
voyance cartes
Thank you for such a well written article. It’s full of insightful information and entertaining descriptions. Your point of view is the best among many.