
America has become much more metropolitan since 1950, when the Office of Management and Budget released the first modern criteria for determining the boundaries of metropolitan areas. Metropolitan areas are the economic or functional definition of the "city." They are otherwise known as labor markets and include the physical "urban area" (the area of continuous development) as well as economically connected rural territory from which people commute into the urban area. A previous article examined the development of the “physical” form of the city (urban areas) in the United States, from 1920 to 2010 (See Observations on Urbanization: 1920-2010).
Major Metropolitan Areas in 1950
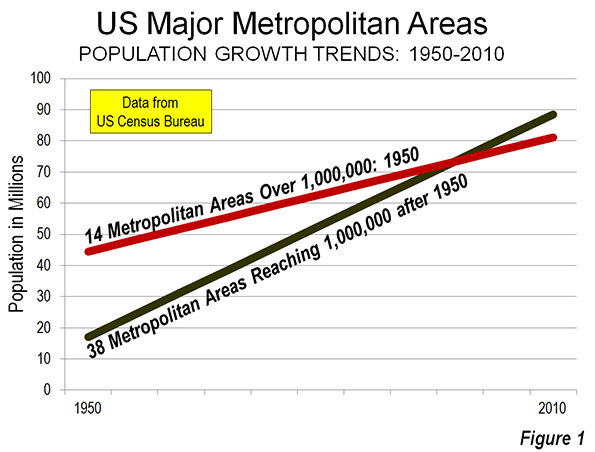
In 1950, there were 14 major metropolitan areas in the United States (over 1,000,000 population). Their combined population was 44.5 million. By 2010, there were 52 major metropolitan areas, with a total population of 169.5 million. This increase, 124 million, is approximately equal to the population of France and the United Kingdom combined. While major metropolitan areas were increasing their population by 281 percent, the rest of the nation grew only 106 percent (Note 1).
Dispersion to Smaller Metropolitan Areas
As the nation was moving to major metropolitan areas, much of the growth was in the 38 smaller metropolitan areas that passed the 1,000,000 mark after 1950. These areas had 17.7 million residents in 1950. By 2010 they had added more than 70 million new residents, for a total population of 88.5 million. In contrast, the 14 metropolitan areas that had more than 1,000,000 population in 1950 grew only 36.5 million, to 81.1 million (Figure 1).
Among the metropolitan areas that had reached 1,000,000 population by 2010, the fastest growing were all in the Sun Belt. Las Vegas, which was too small to be a metropolitan area in 1950, grew 39 times (3,941 percent) compared to the 1950 population for the area constituting the 2010 metropolitan definition (Clark County). Orlando grew 17.6 times (1,757 percent), while Riverside-San Bernardino grew 14 times (1,400 percent). Three other metropolitan areas grew 10 times or more, including Phoenix at 11.6 times (1,164 percent), Charlotte at 10.3 times (1,025 percent) and Miami at 10.2 times (1,017 percent).
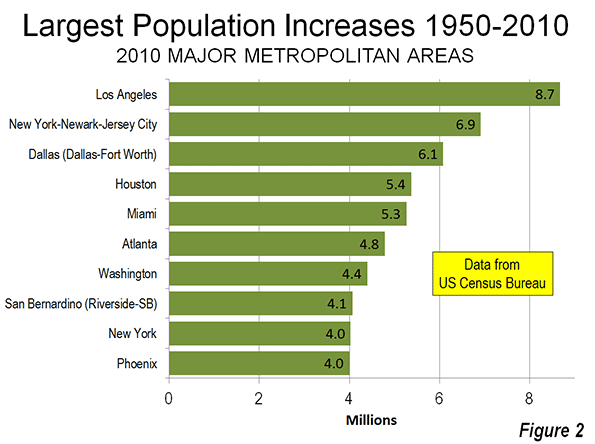
Los Angeles added the most to its population, at 8.7 million residents from 1950 to 2010. Perhaps surprisingly, however, New York also grew strongly, adding 6.9 million residents. Los Angeles, which grew quickly until recently, managed to reduce New York’s 8.5 million 1950 lead by only one-fifth by 2010. Dallas-Fort Worth added the third greatest number of new residents (6.1 million), partially by absorbing the former (and smaller) Fort Worth metropolitan area during the period. Houston added 5.4 million residents. Miami added 5.4 million residents, also incorporating smaller metropolitan areas, Fort Lauderdale and West Palm Beach. Chicago ranked surprisingly high, adding 4.0 million residents, the result of comparatively strong growth in the early decades (Figure 2). The strong population growth evident in New York and Chicago is largely attributable to much faster growth rates between 1950 and 1970 period.
The ascendancy of Texas is illustrated by the fact that its two largest metropolitan areas, Dallas-Fort Worth and Houston added more residents (Note 2) than the two largest metropolitan areas in California, Los Angeles, and San Francisco (11.5 million compared to 10.9 million). However, stronger long term California growth was indicated by the 4.1 million addition to the Riverside-San Bernardino metropolitan area (the “Inland Empire”), which is adjacent to the Los Angeles metropolitan area and has emerged as the dominant growth center of the state in recent decades.
Similar Regions, Big Differences
There were substantial contrasts in growth between similarly sized metropolitan areas in 1950 over the period.
Atlanta and nearby Birmingham were similar in population in 1950. Atlanta had a population of 672,000 (ranked 23) and Birmingham had 559,000 (ranked 27). By 2010, Atlanta had risen to a population of 5.3 million and a rank of 9th, compared to Birmingham’s 1.1 million and a rank of 49th.
A somewhat smaller, but significant difference is evident between Seattle and nearby Portland, which were nearly the same size in 1950 (733,000 and 705,000 respectively) ranking 20th and 21st respectively. Over the next 60 years, Seattle grew 2.8 million (some of it from absorbing the former Tacoma metropolitan area). By 2010, Seattle was the 15th largest metropolitan area in the nation, while Portland had fallen to 23rd, adding a smaller 1.5 million residents. Portland and San Francisco were the only major metropolitan areas in the West to fall in the national rankings between 1950 and 2010.
Slower Growth Major Metropolitan Areas
The slowest growing major metropolitan areas were Buffalo (4 percent), Pittsburgh (6 percent), Cleveland (41.7 percent), Detroit 42.4 percent and New York (52 percent (Table 1).
| Table 1 | ||||||
| Major Metropolitan Areas: 2010, Change from 1950 | ||||||
| Population | Rank | |||||
| Metropolitan Area | 1950 | 2010 | Change | 2012 | 1950 | 2010 |
| Atlanta, GA | 671,797 | 5,286,732 | 687% | 5,457,831 | 23 | 9 |
| Austin, TX | 160,980 | 1,716,286 | 966% | 1,834,303 | 107 | 35 |
| Baltimore, MD | 1,337,373 | 2,710,489 | 103% | 2,753,149 | 12 | 20 |
| Birmingham, AL | 558,928 | 1,128,050 | 102% | 1,136,650 | 27 | 49 |
| Boston, MA-NH | 2,389,986 | 4,552,402 | 90% | 4,640,802 | 6 | 10 |
| Buffalo, NY | 1,089,230 | 1,135,511 | 4% | 1,134,210 | 14 | 47 |
| Charlotte, NC-SC | 197,052 | 2,217,035 | 1025% | 2,296,569 | 91 | 24 |
| Chicago, IL-IN-WI | 5,495,364 | 9,461,105 | 72% | 9,522,434 | 2 | 3 |
| Cincinnati, OH-KY-IN | 904,402 | 2,114,580 | 134% | 2,128,603 | 15 | 28 |
| Cleveland, OH | 1,465,511 | 2,077,240 | 42% | 2,063,535 | 10 | 29 |
| Columbus, OH | 503,410 | 1,901,965 | 278% | 1,944,002 | 32 | 32 |
| Dallas-Fort Worth, TX | 614,799 | 6,426,210 | 945% | 6,700,991 | 24 | 4 |
| Denver, CO | 563,832 | 2,543,478 | 351% | 2,645,209 | 26 | 21 |
| Detroit, MI | 3,016,197 | 4,296,247 | 42% | 4,292,060 | 5 | 12 |
| Grand Rapids, MI | 288,292 | 988,938 | 243% | 1,005,648 | 60 | 52 |
| Hartford, CT | 358,081 | 1,212,384 | 239% | 1,214,400 | 47 | 44 |
| Houston, TX | 806,701 | 5,920,456 | 634% | 6,177,035 | 18 | 6 |
| Indianapolis. IN | 551,777 | 1,887,877 | 242% | 1,928,982 | 29 | 33 |
| Jacksonville, FL | 304,029 | 1,345,596 | 343% | 1,377,850 | 56 | 40 |
| Kansas City, MO-KS | 814,357 | 2,009,338 | 147% | 2,038,724 | 17 | 30 |
| Las Vegas, NV | 48,289 | 1,951,269 | 3941% | 2,000,759 | NA | 31 |
| Los Angeles, CA | 4,367,911 | 12,828,842 | 194% | 13,052,921 | 3 | 2 |
| Louisville, KY-IN | 576,900 | 1,235,708 | 114% | 1,251,351 | 25 | 43 |
| Memphis, TN-MS-AR | 482,393 | 1,324,829 | 175% | 1,341,690 | 36 | 41 |
| Miami, FL | 498,084 | 5,564,657 | 1017% | 5,762,717 | 34 | 8 |
| Milwaukee,WI | 871,047 | 1,555,908 | 79% | 1,566,981 | 16 | 39 |
| Minneapolis-St. Paul, MN-WI | 1,116,509 | 3,348,859 | 200% | 3,422,264 | 13 | 16 |
| Nashville, TN | 321,758 | 1,670,890 | 419% | 1,726,693 | 55 | 37 |
| New Orleans. LA | 685,405 | 1,189,863 | 74% | 1,227,096 | 22 | 46 |
| New York, NY-NJ-PA | 12,911,944 | 19,567,407 | 52% | 19,831,858 | 1 | 1 |
| Oklahoma City, OK | 325,352 | 1,252,992 | 285% | 1,296,565 | 53 | 42 |
| Orlando, FL | 114,950 | 2,134,411 | 1757% | 2,223,674 | 138 | 27 |
| Philadelphia, PA-NJ-DE-MD | 3,671,048 | 5,965,341 | 62% | 6,018,800 | 4 | 5 |
| Phoenix, AZ | 331,770 | 4,192,887 | 1164% | 4,329,534 | 51 | 14 |
| Pittsburgh, PA | 2,213,236 | 2,356,285 | 6% | 2,360,733 | 8 | 22 |
| Portland, OR-WA | 704,829 | 2,226,009 | 216% | 2,289,800 | 21 | 23 |
| Providence, RI-MA | 737,203 | 1,600,852 | 117% | 1,601,374 | 19 | 38 |
| Raleigh, NC | 136,450 | 1,130,490 | 729% | 1,188,564 | 125 | 48 |
| Richmond, VA | 328,050 | 1,208,101 | 268% | 1,231,980 | 52 | 45 |
| Riverside-San Bernardino, CA | 281,642 | 4,224,851 | 1400% | 4,350,096 | 63 | 13 |
| Rochester, NY | 487,632 | 1,079,671 | 121% | 1,082,284 | 35 | 51 |
| Sacramento, CA | 277,140 | 2,149,127 | 675% | 2,196,482 | 64 | 25 |
| Salt Lake City, UT | 274,895 | 1,087,873 | 296% | 1,123,712 | 68 | 50 |
| San Antonio, TX | 500,450 | 2,142,508 | 328% | 2,234,003 | 33 | 26 |
| San Diego, CA | 556,808 | 3,095,308 | 456% | 3,177,063 | 28 | 17 |
| San Francisco-Oakland, CA | 2,240,767 | 4,335,391 | 93% | 4,455,560 | 7 | 11 |
| San Jose, CA | 290,457 | 1,836,911 | 532% | 1,894,388 | 59 | 34 |
| Seattle, WA | 732,992 | 3,439,809 | 369% | 3,552,157 | 20 | 15 |
| St. Louis,, MO-IL | 1,681,281 | 2,787,695 | 66% | 2,795,794 | 9 | 18 |
| Tampa-St. Petersburg, FL | 409,143 | 2,783,243 | 580% | 2,842,878 | 41 | 19 |
| Virginia Beach-Norfolk, VA-NC | 446,200 | 1,676,820 | 276% | 1,699,925 | 38 | 36 |
| Washington, DC-VA-MD-WV | 1,464,089 | 5,636,232 | 285% | 5,860,342 | 11 | 7 |
| Notes on changes from 1950 | ||||||
| All first named municipalities were the central cites per OMB in 1950 except: | ||||||
| Norfolk was the central city of Virginia Beach | ||||||
| San Bernardino was the central city of Riverside-San Bernardino | ||||||
| Jersey City and Newark were also central cities of New York | ||||||
| Las Vegas 1950 is for Clark County (was not a metropolitan area) | ||||||
Meanwhile, 11 metropolitan areas fell from the top 50 in 1950. All were in the Northeast or Midwest, except for Knoxville, TN. Youngstown has been beset by economic difficulties throughout most of the period. In 1950, Youngstown was the nation’s 30th largest metropolitan area, larger than Atlanta, Phoenix and Las Vegas. However, Youngstown added only seven percent to its population over the 60 years, and fell to 93rd place. Wheeling-Steubenville (WV-OH) is one of the nation’s few genuine “shrinking cities,” that is a metropolitan area or an urban area that is losing population. Wheeling-Steubenville was ranked 48th in 1950. Since that time, the economic influence of Wheeling has deteriorated so much that OMB has split the metropolitan area into two parts, removing Weirton, WV (which includes Steubenville, OH). The Wheeling metropolitan area is approximately 60 percent smaller than in 1950 (Table 2).
| Table 2 | |||||
| Metropolitan Areas No Longer in Top 50 | |||||
| Population | Rank | ||||
| 1950 | 2010 | Change | 1950 | 2010 | |
| Youngstown, OH-PA | 528,498 | 565,773 | 7% | 30 | 93 |
| Albany, NY | 514,490 | 870,718 | 69% | 31 | 60 |
| Dayton, OH | 457,333 | 799,232 | 75% | 37 | 70 |
| Allentown, PA | 437,824 | 821,173 | 88% | 39 | 67 |
| Akron, OH | 410,022 | 703,205 | 72% | 40 | 74 |
| Springfield, MA | 407,255 | 621,570 | 53% | 42 | 83 |
| Toledo, OH | 395,551 | 610,001 | 54% | 43 | 86 |
| Wilkes-Barre, PA | 392,241 | 563,630 | 44% | 44 | 95 |
| Omaha, NE-IA | 368,395 | 868,116 | 136% | 45 | 61 |
| Wheeling, WV-OH | 354,092 | 147,950 | -58% | 48 | 273 |
| Syracuse, NY | 341,719 | 662,578 | 94% | 49 | 79 |
| Knoxville, TN | 337,105 | 837,571 | 148% | 50 | 64 |
Cities: From Monocentric to Polycentric to Edgeless
The changes that occurred in cities of the United States and elsewhere around the world have extended well beyond the population increases. The former monocentric model of the city, organized around a dense core has been recent placed by the polycentric city (with the new suburban employment centers documented by Joel Garreau as “edge cities”). In its revisions of the metropolitan area criteria for the 2000 census (Note 2), the Office of Management and Budget began defining core (as used in the encompassing metropolitan area term “Core Based Statistical Area”) as the urban area (urbanized area), rather than the former “central cities.” OMB has designated many suburban employment centers as "principal cities," and in consequence no longer has any suburban designation.
Robert Lang of the University of Nevada Las Vegas has shown that the evolution of metropolitan areas has been extending beyond the “edge cities” and has heralded the “edgeless city.” The dispersion continues.
Wendell Cox is a Visiting Professor, Conservatoire National des Arts et Metiers, Paris and the author of “War on the Dream: How Anti-Sprawl Policy Threatens the Quality of Life.
----------------
Note 1: Some of the metropolitan growth occurred as residents in counties that were not metropolitan in 1950 were added to metropolitan areas as their borders were defined outward. The current boundaries of the major metropolitan areas would have increased their 1950 population by 17 percent.
Note 2: The OMB final notice for 2010 defines “core” as “A densely settled concentration of population, comprising either an urbanized area (of 50,000 or more population) or an urban cluster (of 10,000 to 49,999 population) delineated by the Census Bureau, around which a Core Based Statistical Area is delineated. According to the OMB definition, the core is now an entire urban area, not a central city. The “building blocks” of urban areas are census blocks (smaller than census tracts), rather than municipalities, as had been the case before 2000.
Photo: Crystal City Employment Center: Virginia suburbs of Washington (by author)


This is a amazing web page
This is a amazing web page and I can not suggest you people enough. Complete of useful source and excellent structure very simple on the sight. Please do keep up this excellent work. voyance gratuite
I found your this post while
I found your this post while searching for some related information on blog search...Its a good post..keep posting and update the information.
how can i have bigger breasts without surgery
Excellent Blog! I would like
Excellent Blog! I would like to thank for the efforts you have made in writing this post. I am hoping the same best work from you in the future as well. I wanted to thank you for this websites! Thanks for sharing. Great websites! poster's site
I really enjoy simply
I really enjoy simply reading all of your weblogs. Simply wanted to inform you that you have people like me who appreciate your work. Definitely a great post. Hats off to you! The information that you have provided is very helpful. hier ist was ich gefunden
This is a great inspiring article. I am pretty much pleased with your good work. You put really very helpful information. Keep it up. Keep blogging. Looking to reading your next post. girlfriend activation system download free
it was a wonderful chance to
it was a wonderful chance to visit this kind of site and I am happy to know. thank you so much for giving us a chance to have this opportunity..
Edward Bass New York
This is my first time i
This is my first time i visit here. I found so many interesting stuff in your blog especially its discussion. From the tons of comments on your articles, I guess I am not the only one having all the enjoyment here! keep up the good work
verhuur planten
I just found this blog and
I just found this blog and have high hopes for it to continue. Keep up the great work, its hard to find good ones. I have added to my favorites. Thank You.
ip stresser
Hi I found your site by
Hi I found your site by mistake when i was searching yahoo for this acne issue, I must say your site is really helpful I also love the design, its amazing!. I don’t have the time at the moment to fully read your site but I have bookmarked it and also add your RSS feeds. I will be back in a day or two. thanks for a great site.
what to do when your bored
Took me time to read all the
Took me time to read all the comments, but I really enjoyed the article. It proved to be Very helpful to me and I am sure to all the commenters here! It’s always nice when you can not only be informed, but also entertained!
short let apartments London Bloomsbury
Pretty good post. I just
Pretty good post. I just stumbled upon your blog and wanted to say that I have really enjoyed reading your blog posts. Any way I’ll be subscribing to your feed and I hope you post again soon.
Battlefield Play4Free Funds Generator