
The American Public Transportation Association (APTA) is out with news of higher transit ridership. APTA President and CEO Michael Melaniphy characterizes the new figures as indicating "a fundamental shift going on in the way we move about our communities.” Others even characterized the results as indicating "shifting consumer preferences." The data shows either view to be an exaggeration.
1935 and 2013
This is hardly a reliable time for making judgments about fundamental shifts or shifts in consumer preferences. Economic performance has been more abysmally abnormal only once in the last century –during the Great Depression – than at present.
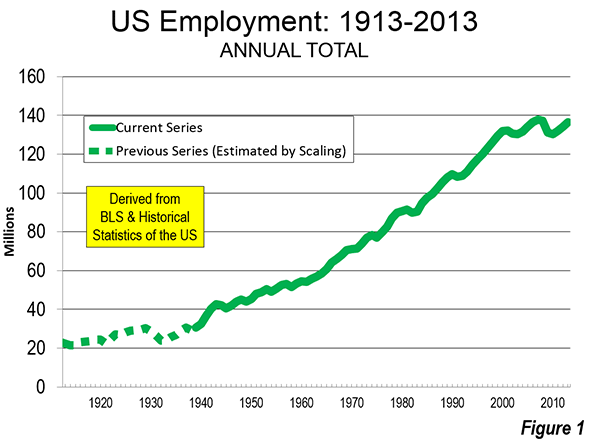
The last year, 2013, is the sixth year in a row that total employment, as reported by the Bureau of Labor Statistics was below the peak year of 2007 (Figure 1). This run of dismal job creation was exceeded only between the Great Depression years of 1929 and 1936 in the last 100 years (Note 1). From World War II until the Great Recession, the maximum number of years that employment fell below a previous peak was two, following the 9/11 terrorist attacks (2001 to 2003). The Great Recession may have ended, according to the National Bureau of Economic Research, but the Great Malaise continues as the economy is performing well below historic levels. Judgments about fundamental shifts and consumer choice today are not more reliable than they would have been in the Great Depression year of 1935.
Transit's Market Share: Stuck in Neutral
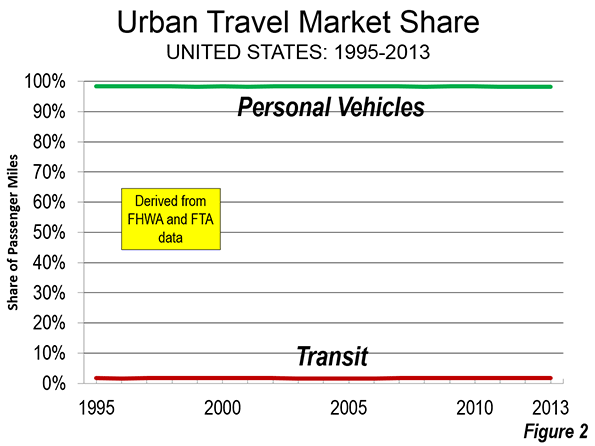
But more importantly, there is no shift to transit. APTA is right to point out that transit ridership has grown faster than vehicle travel in the United States since 1995. Nonetheless, transit's share of urban travel has barely budged, because its 1995 share of travel was so small. This is indicated by Figure 2, which compares the overall market share of transit to that of cars and light trucks from 1995 to 2013. Indeed, the top of Figure 2 (the 100 percent line) is virtually indistinguishable from the personal vehicle share over the entire period. The bottom of the chart (the zero percent line) is virtually indistinguishable from the transit share. This is not the stuff of fundamental shift.
Commuting: The Story is Not Transit
A similar pattern of little or no change is indicated by the commuting (work access) data from the Census Bureau's American Community Survey.
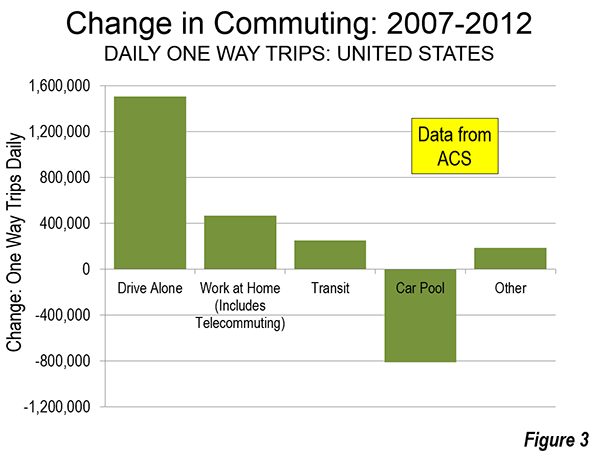
Over the past five years, as with virtually all the years since such data has been collected, the overwhelming majority of new commuters have driven alone (Figure 3). Indeed, transit has not taken a single net automobile off the road since 1960, and not in the last five years. Between 2007 and 2012, 93 percent of the additional commuters drove alone (Note 2). The drive alone market, which might have been thought to be saturated, actually rose from 76.1 percent to a 76.3 percent market between 2007 and 2012.
The biggest change has been the continuing loss in carpool use, which dropped from 10.4 percent to 9.7 percent from 2007 to 2012. It is estimated that nearly 450,000 passengers left carpools (excluding drivers), approximately 1.8 passengers for each additional commuter using transit (250,000).
The largest gain from 2007 to 2012 was in working at home, including telecommuting. Working at home increased from 4.1 percent to 4.4 percent. In actual numbers, working at home added 1.9 times the increase in transit commuting. Its change in market share was greater than that of transit in 42 of the 52 major metropolitan areas. Surprisingly, this includes New York, with its incomparable transit system (by US standards).
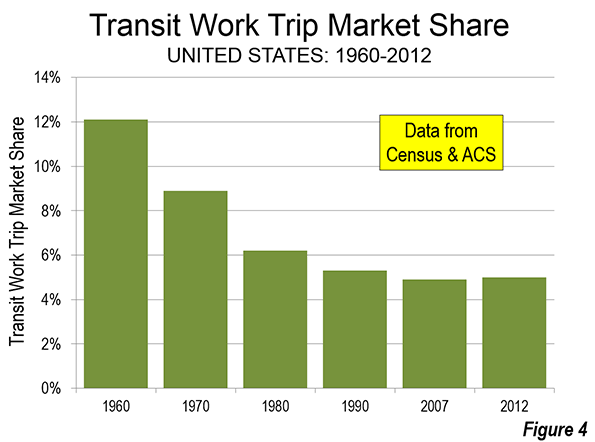
Transit's share of commuting inched up only 0.1 percentage points between 2007 and 2012. This is so small that if this rate of annual increase were sustained for 50 years, transit's commute market share would edge up to only 6 percent (Figure 4), approximately transit's 1980 market share (doubling to 10 percent would require 130 years). The latest data indicates both gains and losses for transit, with market shares up in 28 major metropolitan areas and down in 24.
Transit Losses
In Atlanta, with the nation's second largest Metro (subway) system built since 1975, a declining overall employment base was accompanied by a loss of 13,000 transit commuters, at the same time that there was an increase in working at home of 19,000.
In Portland, considered by many around the world to be an urban planning Utopia, the data is hardly favorable. Since 1980, the last year with data before the first of five light rail lines and one commuter rail line opened, transit's market share has dropped from 8.4 percent to 6.0 percent. While spending billions of dollars on rail, working at home – which involves little or no public expenditure – increased by triple the number of people drawn to transit. And things have not changed materially, even during the claimed "fundamental shift." In the last five years, the working at home increase is more than double that of transit.
In Los Angeles, ridership at the largest transit agency continues to languish below its 1985 peak, despite having opened 9 light rail, Metro, and rapid busway lines and adding more than 1.5 million residents. Even this decline may be under-stated because of how transit counts passengers. Each time someone steps on a transit vehicle, they are counted (as a boarding). A person who transfers between two or three buses to make a trip counts as two or three boardings, which is what the APTA data reports.
When rail is added to a transit system, bus services are reconfigured to serve the rail system. This can mean many more boardings from transfers without more passenger trips. This potential inflation of ridership is likely to have occurred not only in Los Angeles, but in all metropolitan areas that added rail systems.
Transit Gains
At the same time, gains are being made in some metropolitan areas. Ridership has risen more strongly in transit's six "legacy cities," the municipalities (not metropolitan areas) of New York, Chicago, Philadelphia, San Francisco, Boston, and Washington. Between 2007 and 2012, 68 percent of the additional transit commuting occurred to employment locations in these six municipalities. This is higher than the 55 percent of national transit commuting that these areas represented in 2012. The much larger share being attracted by these areas in the last 5 years is an indication that transit ridership, already highly concentrated in just a few places, is becoming even more concentrated. Further, 50 percent to 75 percent of commuters to the corresponding six downtowns reach work by transit.
Rational Consumer Behavior
Even when the nation finally emerges from the Great Malaise, only vain hope will be able to conceive of a large scale consumer preference driven shift toward transit. The rational consumer will not choose transit that is slower or less convenient than the car. Where transit access is impractical or impossible, people will use cars. This is the case for most trips in all US metropolitan area, as the Brookings Institution research cited below indicates
The Brookings Institution research indicated that the average employee in the nation's major metropolitan areas are able to access fewer than 10 percent of jobs in 45 minutes. This is not only a small number of jobs, but it is a travel time that is approximately twice that of the average employee in the United States (most of whom travel by car).
More funding for transit cannot solve this problem. The kind of automobile competitive transit system needed to provide rational consumer choice between cars and transit would require annual expenditures rivaling the total personal income in the metropolitan area, as Jean-Claude Ziv and I showed in our 2007 11th World Conference on Transport Research paper (2007). It is no wonder that not a single comprehensive automobile competitive transit system exists or has been seriously proposed in any major US or Western European metropolitan area (Note 3). Transit is about the largest downtowns and the largest urban cores.
Unbalanced Coverage
All of this appears to have escaped many media outlets, which largely parroted the APTA press release. For example, The New York Times, CBS News, the Washington Post, and the Chicago Tribune were as parish newsletters commenting on a homily by the priest, for their failure to report both sides. A notable exception was USA Today, whose reporter consulted outsider Alan Pisarski (who has written for newgeography.com). Pisarski placed the APTA figures in historical context and expressed reservations about restoration of the transit commuting share numbers of 1980 or before.
Wendell Cox is principal of Demographia, an international public policy and demographics firm. He is co-author of the "Demographia International Housing Affordability Survey" and author of "Demographia World Urban Areas" and "War on the Dream: How Anti-Sprawl Policy Threatens the Quality of Life." He was appointed to three terms on the Los Angeles County Transportation Commission, where he served with the leading city and county leadership as the only non-elected member. He was appointed to the Amtrak Reform Council to fill the unexpired term of Governor Christine Todd Whitman and has served as a visiting professor at the Conservatoire National des Arts et Metiers, a national university in Paris.
Photograph: DART light rail train in downtown Dallas (by author)
---------------------
Note 1: Current Employment Statistics Survey data, 1939 to 2013. 1913 to 1938 estimated from data in Historical Statistics of the United States: Bicentennial Edition.
Note 2: The source for the commuting data is the American Community Survey of the Census Bureau, which indicates an employment level in 2012 that is higher than in 2007. The Current Employment Statistics Survey of the Bureau of Labor Statistics indicates a decline.
Note 3: I would be pleased to be corrected on this. In 2004, we issued a challenge on this subject, and while there were some responses, none met the required criteria (see http://demographia.com/db-challenge-choice.htm). The criteria are repeated below:
To identify an actual system or propose a system that provides the following in an urban area of more than 1,000,000 population:
· Transit choice (automobile competitive public transport service) for at least 90 percent of trips and passenger kilometers in the particular urban area.
· Automobile competitiveness is defined as door to door trip times no more than 1.5 times automobile travel time.
The description of any system not already in operation should also include an estimate of its cost, capital and annual operating.


Transit in big cities
Especially in modern and big cities we have found a highly developed transportation system; that interconnect the entire city with different roads and big traveling vehicles. Most probably transportation system is developed through suitable vehicle facilities, transit system and many other reasons. From the last few years we have noticed certain big changes in the transportation system of the United States of America; therefore we can frequently say that transportation system is the lifeline of every country.
Land Rover repair Gardena
Fundamental Challenge
Thanks for this interesting analysis. This is an interesting problem where it is in everyone's interests (it seems) to report positive interpretations, so the truth of failing conditions is obscured.
What is failing, and is the fundamental challenge, is what to do about high levels of concurrent driving.
High levels of concurrent driving, given the amount of road, is what causes the worst traffic congestion. When the amount of traffic demand exceeds the capacity of the road, much greater amounts of energy are wasted, and greater levels of emissions occur, as the vehicles idle in stop and go traffic.
Many think this is an engineering problem and conclude that transport engineers or planners are to blame because they didn't build the facility large enough. The reality is that the problem is within the capacity of the community to solve - there just need to be fewer trips as 'driver', and a greater proportion as 'passenger'.
But about the statistics that are referred to in this article. The author has been remiss in not drawing attention to their limitations: the ACS data reports only 'main mode'. Supposing you were a carpool passenger 2 days out of 5, and a drive alone commuter the other three, you would be caught by ACS as a drive-alone commuter. Your use of a more community friendly mode 40% of the time would be lost through the way the statistics are gathered.
It would also be helpful if the author had looked into the source of the reduction in carpooling - much of it occurred in the construction industry, rather than across the board. What are the implications of this for the conclusions he draws?
The point being a simplified interpretation can be as wrong from either side. It was good to see balance being offered to the topic.